
Kubernetes Insights Report - June 2026
Published in July 2026
TL;DR: Every month, the LearnKube network (LearnKube, Kube Architect, Kubesploit, Kube Builders, Kube Events, Kube Careers, KubeFM, and Kube Today) curates and shares Kubernetes news, tutorials, and tools across social media. This report examines what readers engaged with most in June 2026: which topics drew interest, which content formats drove clicks, and what the data says about where the Kubernetes community’s attention is heading.
In June 2026, 1,441 pieces of Kubernetes content reached readers across multiple platforms, totaling 804,051 views.
We published 13% fewer pieces in June 2026 than in May. Impressions fell 30%, and content efficiency dropped 19% month-on-month. A major social platform changed drastically, requiring us to adjust our publishing strategy for the second half of 2026.
Executive Summary
Readership Dashboard — June vs May 2026
Readers viewed our content 804,051 times in June 2026 — 30% lower than May 2026, 12% below the 2026 average so far, and 6.35% higher than June 2025.
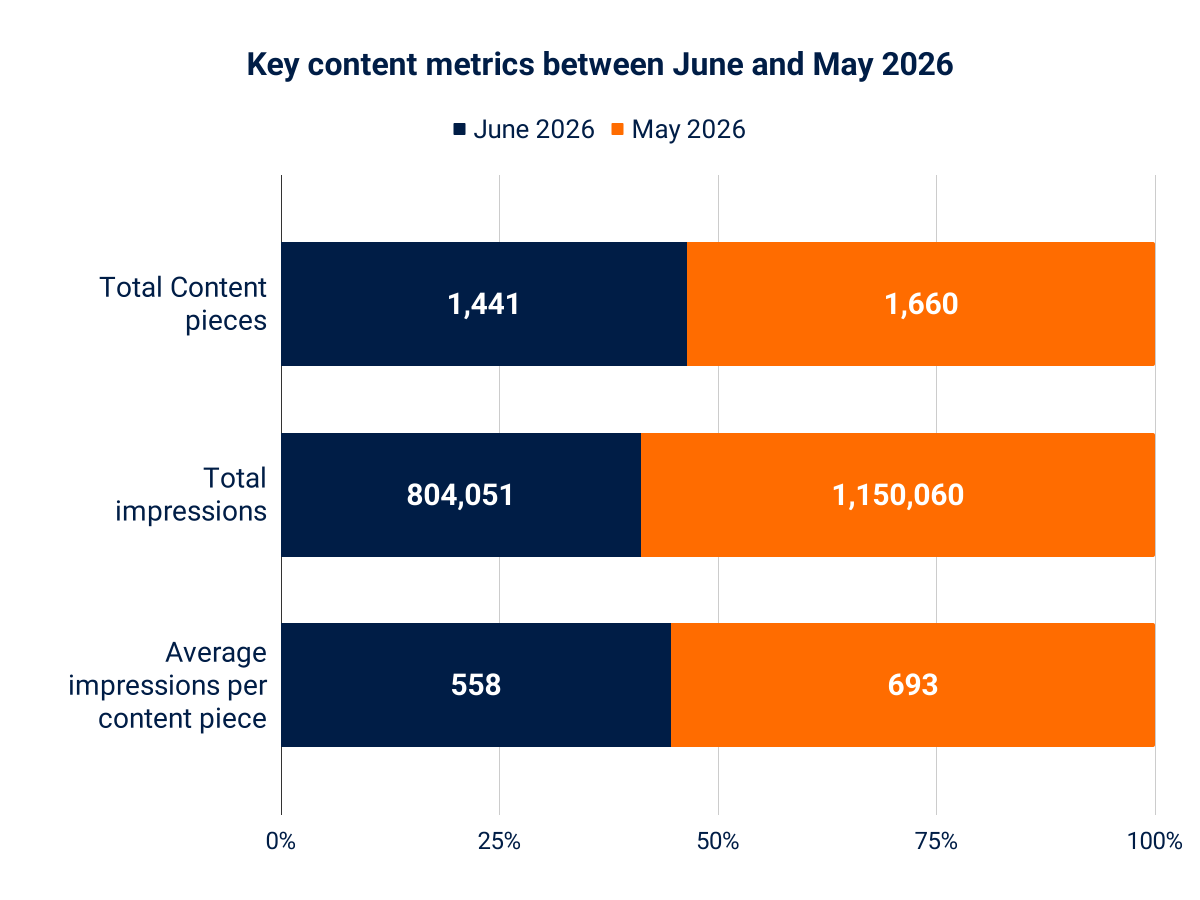
Overall impressions fell 30% month-on-month, and content efficiency declined 19%. The drop can be attributed to one major reason (more on this later).
Top 3 Readership Insights
- Observability momentum held — The category generated more than 36,000 impressions and 1,060 impressions per content piece.
- Networking is the new evergreen topic — It ranked among the top two categories four times in the past six months and delivered June's highest content efficiency at 1,259 impressions per post.
- Security-focused content drew the most attention — The category generated more than 56,000 impressions and 1,100 impressions per content piece.
Where Readers Found Content
Let’s look at where readers discovered content across platforms.
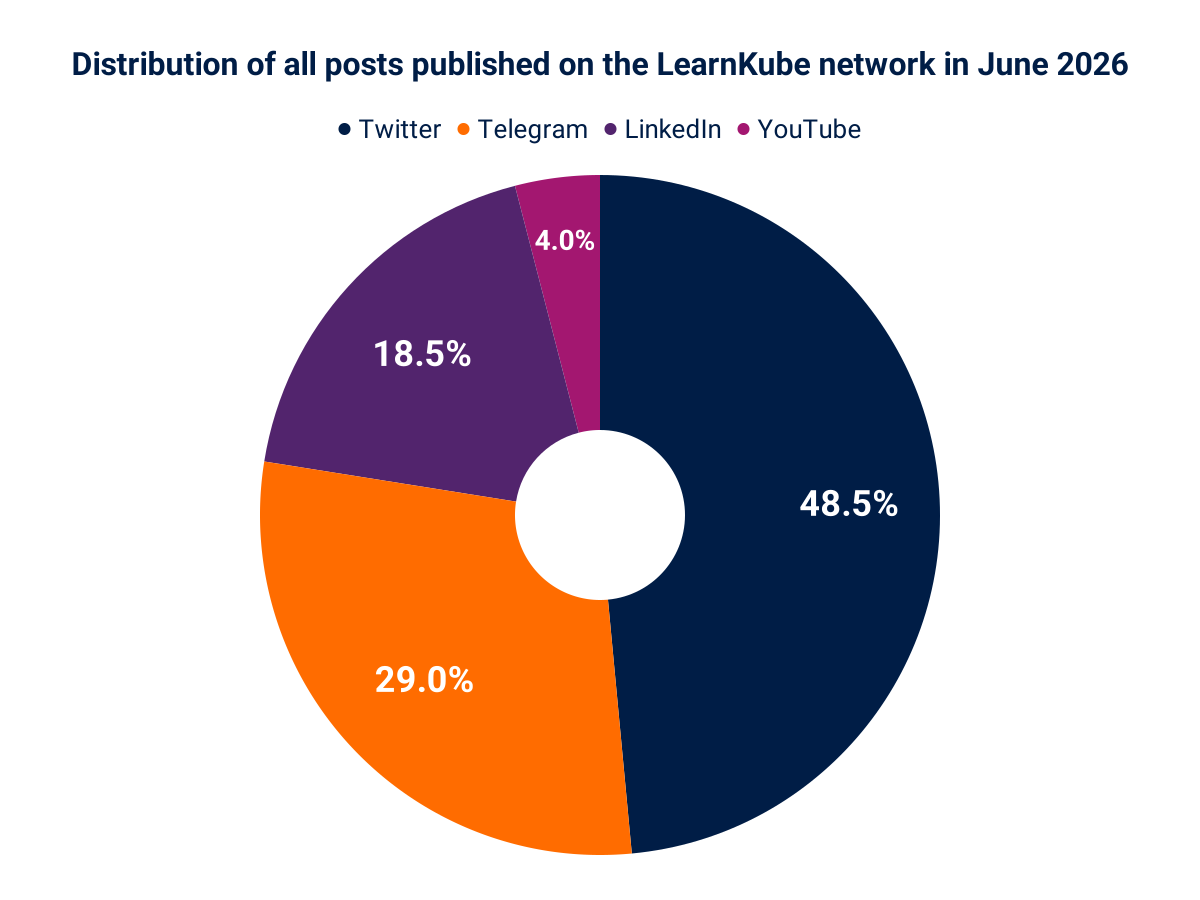
Readers encountered 48.5% of content on Twitter, 29% on Telegram, 18.5% on LinkedIn, and 4% on YouTube.
How did reader engagement vary across these platforms?
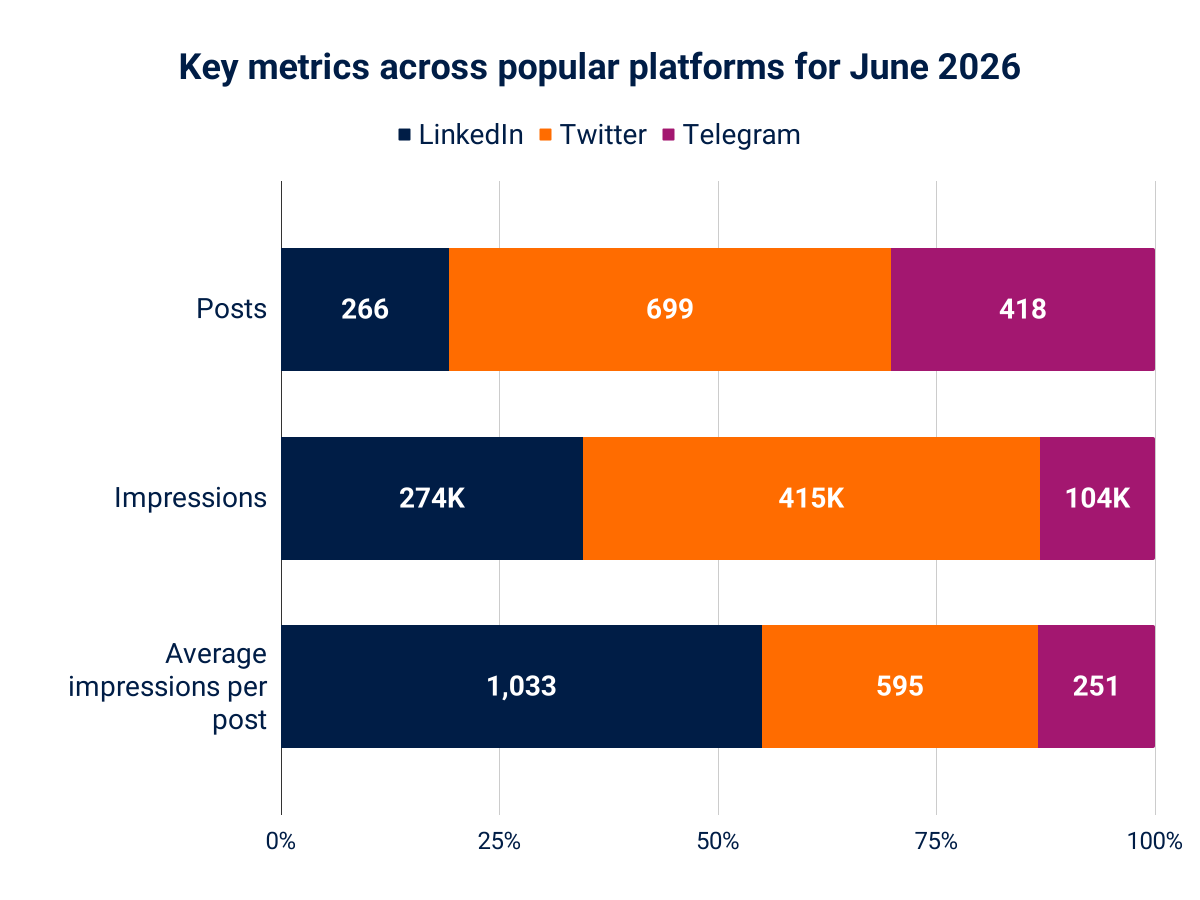
Platform performance remains consistent across the major platforms, barring one.
We underestimated the rebuild needed to bring LinkedIn viewership back to normal, or higher. For the second month in a row, platform impressions fell 44%, and content efficiency dropped 33% from May 2026.
The LinkedIn decline continues
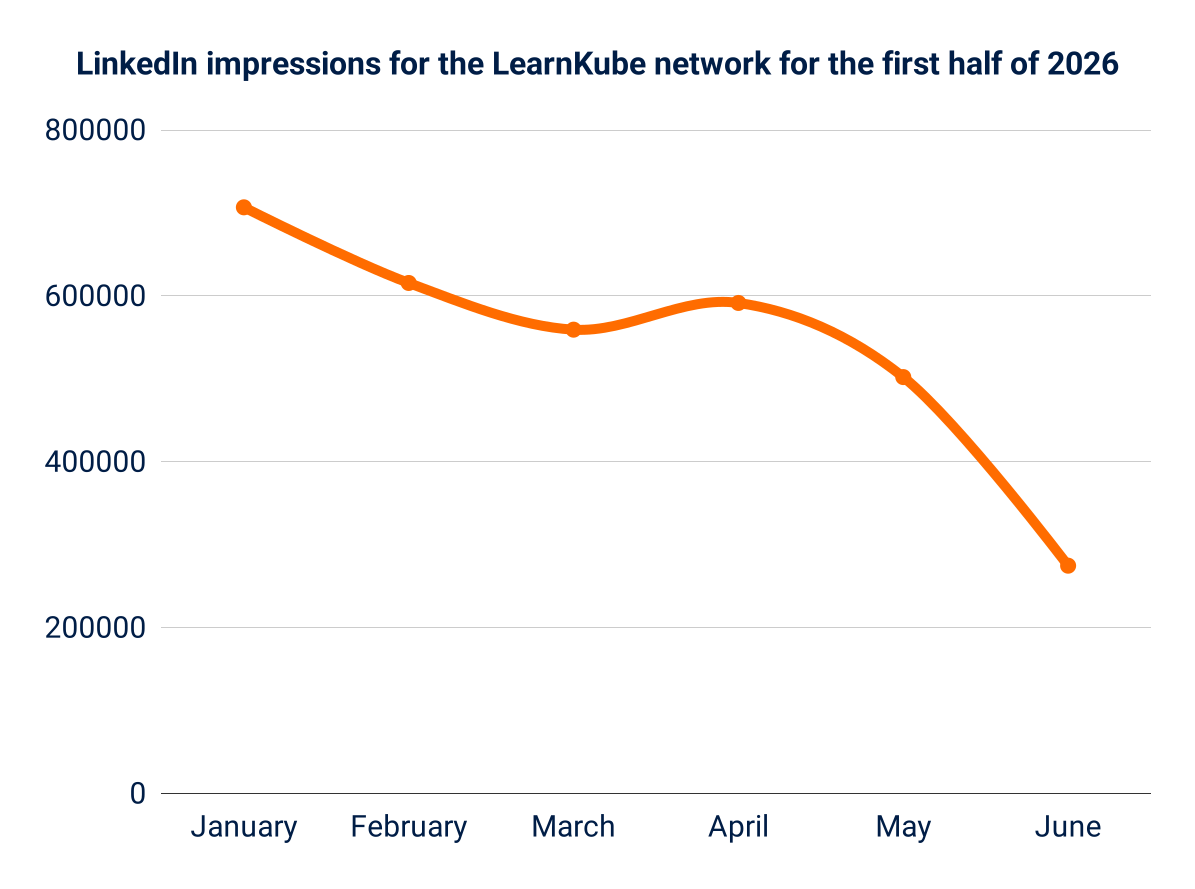
In our May 2026 KTT report, we noted that LinkedIn's full rollout of the Feed-SR and 360Brew models had affected our platform metrics. We could not adjust our publishing approach quickly enough to regain that viewership in June.
Still, our analysis of the platform's model revealed useful insights.
For the new LinkedIn, semantic relevance reigns supreme
Going forward, 360Brew will be LinkedIn’s foundational model, and all features will be built on it. LiNR and Feed-SR are sub-systems that decide the user's feed.
In short, LiNR retrieves content relevant to a particular user, and Feed-SR filters and ranks it based on how likely the user is to find it relevant.
What this means for the Kubernetes audience on LinkedIn:
- Your LinkedIn feed is now more bespoke than ever. It is ranked by how relevant the content is to your career profile, past content interactions, and more.
- Traditional post interactions, such as likes and generic comments, carry less weight. Dwell time, substantive comments, and the recency of interactions carry more weight.
What this means for Kubernetes content creators and marketers:
- Focus on the specificity of your brand, whether personal or organizational. If you create cloud security content, staying in that category should help it gain traction on LinkedIn. Specificity beats generality.
- Traditional interactions have been superseded by more semantic signals. Publish less if needed, but keep the content high quality; otherwise, it will disappear from your audience's feed.
What Topics Readers Cared About
June brought notable shifts in reader interest across topic categories.
| Categories | Content pieces | Total impressions | Average impressions per piece | CTR |
|---|---|---|---|---|
| Networking | 22 | 27,702 | 1,259 | 1.77% |
| Data on Kubernetes | 6 | 7,365 | 1,228 | 2.01% |
| Configuration Management | 4 | 4,458 | 1,115 | 2.22% |
| Security | 51 | 56,102 | 1,100 | 1.40% |
| Observability | 34 | 36,049 | 1,060 | 1.16% |
| Infrastructure | 56 | 36,586 | 653 | 2.59% |
| Development | 18 | 11,129 | 618 | 2.52% |
| Platform Engineering | 18 | 9,022 | 501 | 2.65% |
| Resource Optimization | 2 | 755 | 378 | 1.59% |
What this says about readers:
- Networking was the most popular content category for June, with over 27,000 impressions and a range-topping efficiency of 1,259 impressions per post. Networking has been the most popular content category for 60 of the last 90 days, confirming that it is the most in-demand topic among the Kubernetes community.
- Observability topics, which sparked interest in May, did not top the efficiency charts, but they still drew 36,000 impressions in total. We'll keep a close eye on the topic, as it may become a trend heading into Q3 2026.
- Security topics generated the most impressions despite an average CTR of 1.40%. The category attracted attention but did not translate that reach into a proportionate number of clicks. Better titles and story arcs may help.
How Reader Engagement Shifted (June vs May 2026)
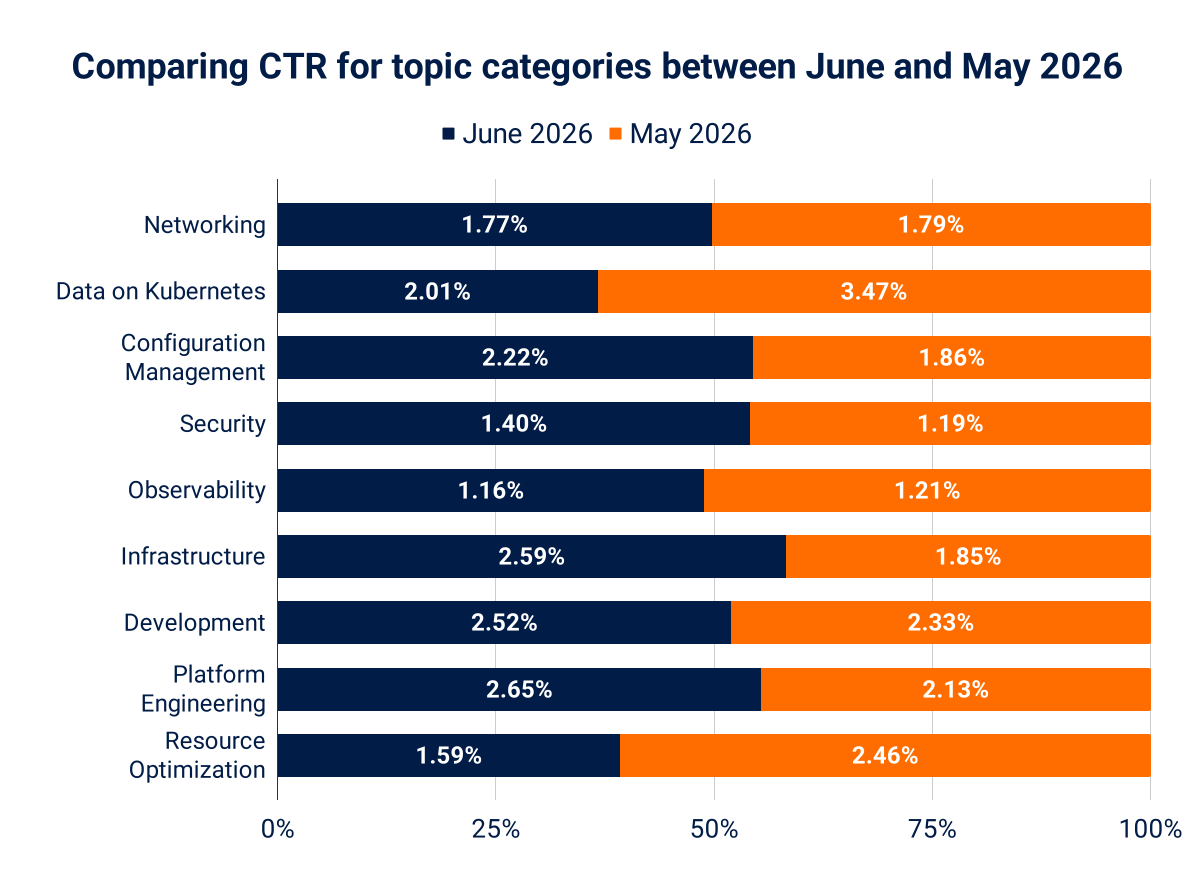
How did click-through behavior change between the two months? (Excluding Edge & IoT due to low volume):
- The biggest gains were in Infrastructure and Platform Engineering, which grew by 0.74 pp and 0.52 pp, respectively.
- The largest declines were in Resource Optimization (down 1.47 pp) and Data on Kubernetes (down 1.46 pp).
- Barring Resource Optimization and Data on Kubernetes, CTR grew for almost every topic, meaning readers clicked more often in June than in May.
Readership by Brand
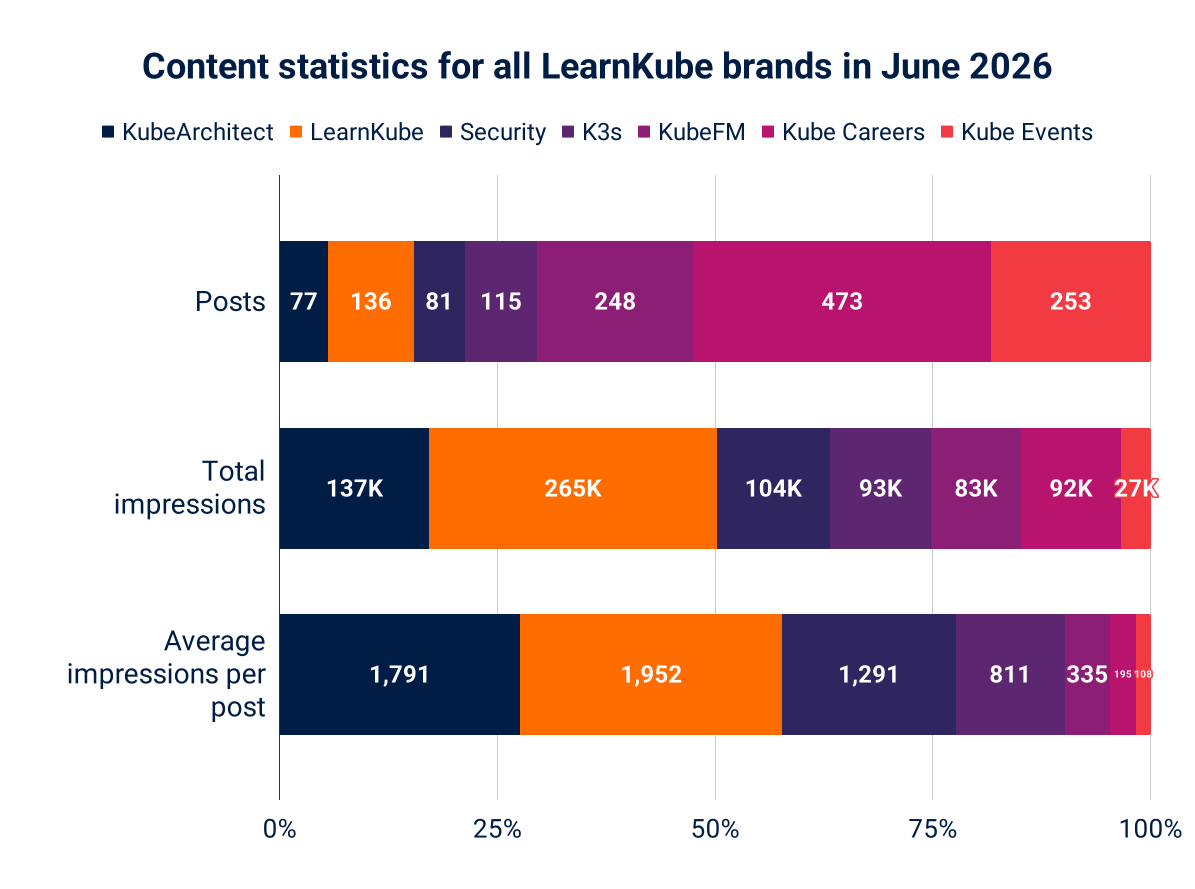
Engagement patterns changed drastically for one brand between May and June 2026:
- For the first time in fifteen months, architecture content was not the most in demand. LearnKube took the top spot with 265,000 impressions and content efficiency of 1,952 impressions per post. More on this later.
- Readers continued to show more interest in tool-focused content than in podcasts (mainly interviews), careers, and events.
Lower LinkedIn volume has hurt our leading brands
The June underperformance of architecture content reflects the LinkedIn viewership decline rather than a shift in audience preference.
As cited in our March 2026 KTT report, 62% of all our LinkedIn impressions came from architecture content. The latest LinkedIn rollouts affected both our viewership on the platform and our best-performing brand.
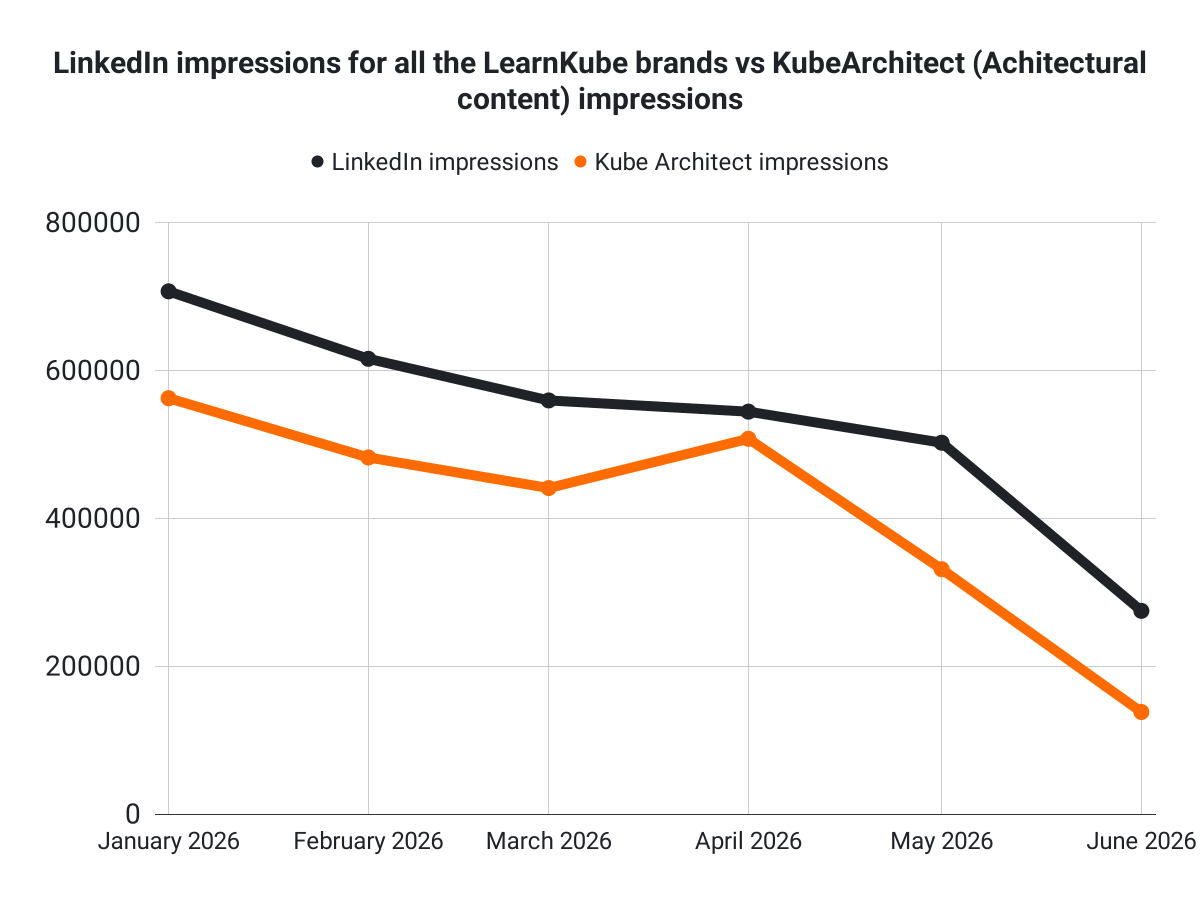
The graph indicates that platform changes, rather than brand health, drove the decline. Aligning our publishing strategy with the platform's needs should help architecture content recover.
If you are a content creator or marketer, note that weak LinkedIn performance will affect your brand metrics. If your LinkedIn viewership has declined recently, align your strategy with the platform's latest changes.
What Readers Clicked On Most
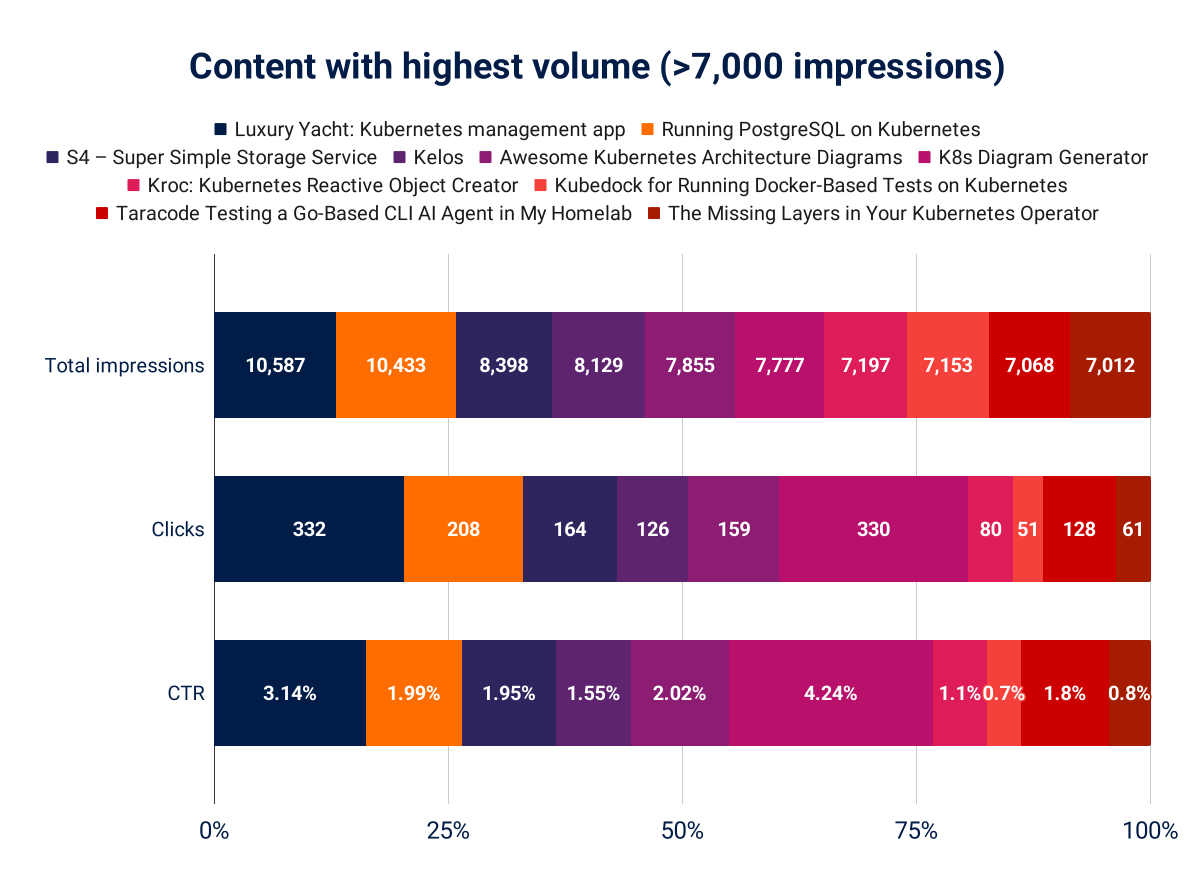
- Tool overviews are a hit with the cloud-native audience. For the third month in a row, they accounted for more than 70% of the highest-volume content.
- The most-viewed piece was a tool overview for Luxury Yacht, a cross-platform app for managing Kubernetes clusters, with 10,587 views. A whitepaper on Running PostgreSQL on Kubernetes followed with 10,433 views, then an overview of S4, a lightweight, self-contained S3-compatible storage solution, with 8,398 views.
- For the second month running, no role vacancy made the most in-demand list. A DevSecOps listing reached #14, suggesting the cloud-native community does seek career listings, especially for security-focused positions.
Most-Clicked Content (>2% CTR and above 4,000 impressions)
| Content | CTR | Total impressions | Clicks |
|---|---|---|---|
| K8s Diagram Generator | 4.24% | 7,777 | 330 |
| Luxury Yacht: Kubernetes management app | 3.14% | 10,587 | 332 |
| Taming the Storm: Building Groww’s Internal Chaos Engineering Platform | 3.10% | 6,196 | 192 |
| Deploy production generative AI at the edge using Amazon EKS Hybrid Nodes with NVIDIA DGX | 2.39% | 4,315 | 103 |
| hanoi-cli | 2.23% | 6,779 | 151 |
| Conditions, Phases, and Declarative Phase Rules in Kubernetes Operators | 2.13% | 6,894 | 147 |
| OT-CONTAINER-KIT Redis Operator | 2.11% | 4,684 | 99 |
| Sharded multi-cluster cert-manager with multicluster-runtime | 2.10% | 4,629 | 97 |
| Awesome Kubernetes Architecture Diagrams | 2.02% | 7,855 | 159 |
| Running PostgreSQL on Kubernetes | 2.01% | 10,433 | 208 |
Here's what the highest-CTR content says about readers:
- Although tool overviews dominate the list, Groww's walkthrough, Taming the Storm: Building Groww’s Internal Chaos Engineering Platform, shows how a title that suggests a story arc can draw clicks.
- Tool names can also stir audience curiosity. Luxury Yacht attracted both views and a 3.14% CTR.
- A walkthrough does not need an unusual title when it covers an in-demand topic. Deploy production generative AI at the edge using Amazon EKS Hybrid Nodes with NVIDIA DGX and Sharded multi-cluster cert-manager with multicluster-runtime both made the list with direct, descriptive titles.
What happens when we categorize the most-clicked content by topic?
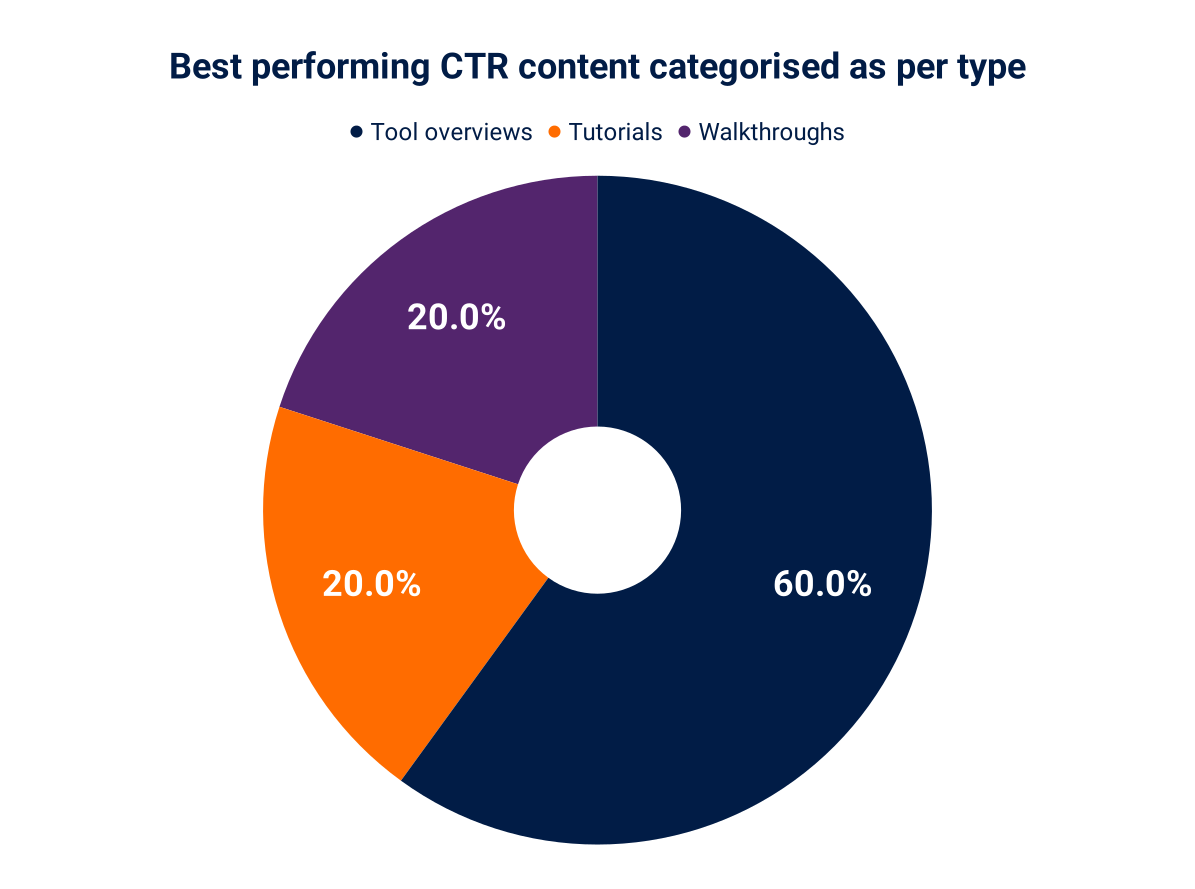
Here are the key takeaways:
- While walkthroughs accounted for 75% of May's best-CTR list, tool overviews accounted for 60% of June's.
- The remaining pieces were split evenly between direct tutorials and experience-based walkthroughs, such as Groww's Taming the Storm: Building Groww’s Internal Chaos Engineering Platform.
Key Trends
Observability momentum held
Observability ranked first for content efficiency in May. In June, its 36,049 impressions and efficiency of 1,060 impressions per piece confirmed that it remains an in-demand category for the Kubernetes audience.
Although not a complete breakout trend, observability is a clear readership favorite with strong volume and efficiency. July's data will show whether that demand continues.
Networking is the theme for 2026 so far
With four top-two placements in the past six months, networking is the Kubernetes audience's favorite topic category so far this year.
The cloud-native community has shown consistent interest in networking, signaling strong demand for the category going into the second half of 2026.
LinkedIn now prioritizes semantic relevance
LinkedIn's latest rollouts are hurting network metrics. The platform delivered its weakest performance of the year, with impressions down 44% month-on-month and content efficiency down 33%.
On the positive side, the analysis reveals that LinkedIn now prioritizes semantic relevance more than ever.
LinkedIn accounts for a major share of the network's viewership, making a strategy change the highest priority.
Great titles drive more clicks
The highest-CTR content for May was Mount Mayhem at Netflix: scaling containers on modern CPUs (3.11%). In June, two of the best-performing pieces were Luxury Yacht: Kubernetes management app (3.14%) and Taming the Storm: Building Groww’s Internal Chaos Engineering Platform (3.10%).
Whether it is a tool overview or a story-driven walkthrough, a good title attracts clicks.
What This Means
1. Prioritize observability content for July 2026
Signal: Reader engagement remained consistent in June following the May 2026 peak. The category generated 36,049 impressions and 1,060 impressions per piece.
Implication: Demand for Observability content has remained consistent for the last 60 days. Increasing content frequency will help the network return to its previous (better) viewership levels.
2. Apply the findings from the LinkedIn platform analysis
Signal: LinkedIn impressions fell 44% from May's already low numbers, and efficiency was down 33%.
Implication: Applying the findings from the platform analysis is the top priority. The publishing strategy must change.
3. Keep publishing networking content unless the data changes
Signal: Networking made the top two popularity rankings for the fourth straight month. It has generated more than 250,000 impressions since the start of 2026, with average content efficiency of 1,012 impressions per post.
Implication: Keep scaling networking-focused content across the brands.
4. Pair in-demand content categories with great titles
Signal: The best-performing CTR content consistently has strong post titles. Two of the top three posts by CTR had intriguing titles.
Implication: Pairing in-demand content with thoughtful titles will help draw more clicks from the audience.
Conclusion
June 2026 exposed the cost of LinkedIn's platform changes while clarifying what the cloud-native community seeks:
- Readers continued to seek observability content, sustaining the category's recent momentum.
- Networking has been an evergreen topic this year and is likely to remain strong in Q3 2026.
- LinkedIn metrics went further down in June, but our analysis of the platform rollouts will help us pick up lost ground for the rest of the year. We aim to keep June 2026 the absolute bottom for the network's LinkedIn viewership.
- Despite lower overall volume in June, the average CTR did not decline month-on-month, indicating that content quality held up as reach fell.
Readers want intriguing titles backed by networking and observability content. Tool overviews and story-driven walkthroughs continue to top the popularity charts, while July's data will show whether those preferences hold.