
Kubernetes Insights Report - March 2026
Published in April 2026
TL;DR: Every month, the LearnKube network (LearnKube, Kube Architect, Kubesploit, Kube Builders, Kube Events, Kube Careers, KubeFM, and Kube Today) curates and shares Kubernetes news, tutorials, and tools across social media. This report looks at what readers engaged with most in March 2026 - which topics sparked interest, which content formats drove clicks, and what the data tells us about where the Kubernetes community's attention is heading.
In March 2026, 1,377 pieces of Kubernetes content reached readers across multiple platforms, totaling 1.14 million views.
March continued February's pattern: readership rose 7% year on year and Q1 2026 finished 6% ahead of Q1 2025, but impressions still fell 7.89% month on month. Q4 2025 remains the network's benchmark quarter.
Executive Summary
Readership Dashboard — March vs February 2026
Readers viewed our content 1,146,770 times in March 2026 - 7.42% higher than March 2025, 3.23% above the 2025 average, but 7.89% lower than February 2026.

While overall impressions have declined by ~7% month-on-month, content efficiency has barely taken a hit (down by a negligible 0.6%), signaling high retention rates for the network.
Q1 2026 is doing better than Q1 2025

Despite a slight month-on-month decline, Q1 2026 is still 5.26% more efficient than its 2025 counterpart.
In short, readers are more engaged than last year. Now Q2 awaits.
Top 3 Readership Insights
- Networking topics are the most content-efficient among major categories — 1,347 impressions per content piece in March.
- Configuration Management held reader interest, again — has maintained at least a second place in the trending list for 6+ months running.
- Tool overviews drive both reach and clicks - 80% of the highest-volume content and 50% of the most-clicked content are tool overviews.
Where Readers Found Content
Let's look at where readers discovered content across platforms.

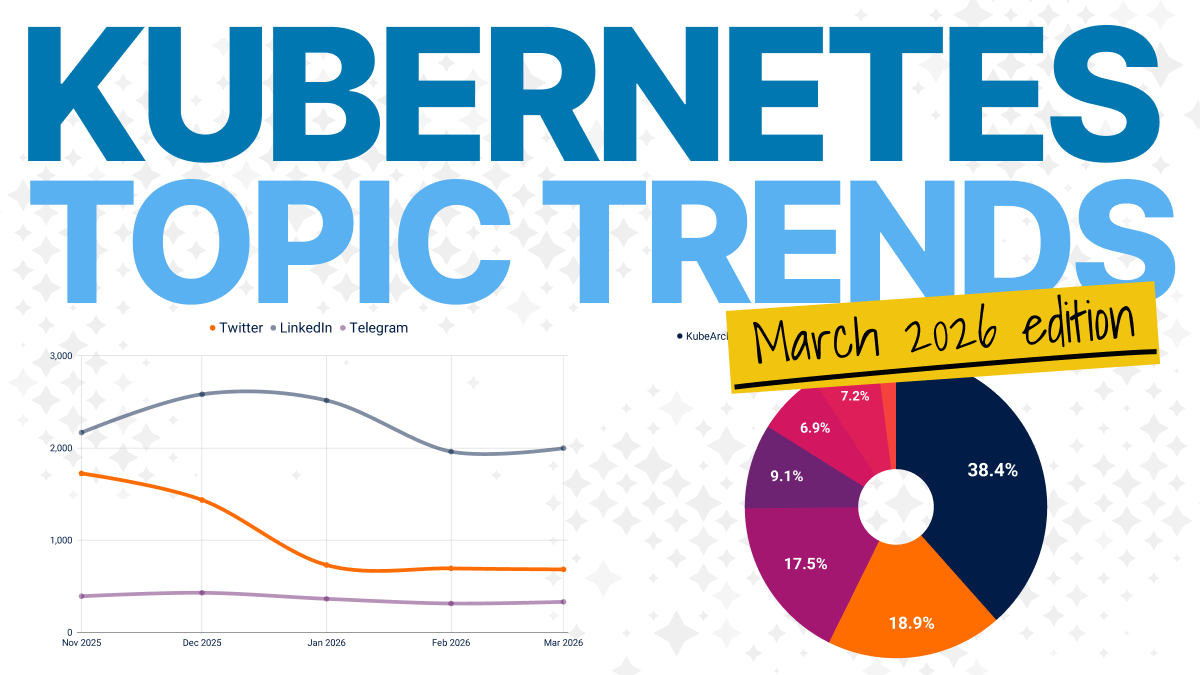
Readers encountered 46.4% of content on Twitter, 33% on Telegram, and 20.3% on LinkedIn.
Readers also had access to four podcast episodes on YouTube and Spotify.
How did reader engagement vary across these platforms during March?

Platform performance remains consistent with recent months: LinkedIn attracts the strongest reader response, with Twitter and Telegram following in both total volume and click efficiency.
If we zoom out, an interesting story starts to emerge.
Twitter engagement kept falling, and the reasons are becoming clearer

Key observations:
- March data confirmed a significant decline in Twitter engagement. In Q1 2026, engagement on Twitter dropped by 40% compared to Q4 2025.
- What led to this change? Though our publishing strategy for Twitter remained the same across both quarters, two significant changes occurred on the platform itself:
- The first change was a November 2025 rollout in which Twitter altered its engagement metric methodology, as documented in our December 2025 report. This adjustment led to a sudden spike in impressions across almost all accounts, creating a substantially higher baseline for comparison in subsequent months and quarters.
- The second change came at the start of 2026, when Twitter shifted to a Grok-based ranking mechanism that prioritizes engagement. The result: user feeds are now shaped by a different set of signals, which affects content discovery and helps explain the lack of impressions among non-followers.
Now that we have a clearer picture of Twitter's decline, the platform's publishing strategy likely needs to change.
If you are a content creator or marketer in the cloud-native space, now is a good time to check whether Twitter metrics have normalized for your brand or account.
What Topics Readers Cared About
March revealed some notable shifts in reader interest across topic categories.
| Categories | Content pieces | Total impressions | Average impressions per piece | CTR |
|---|---|---|---|---|
| Networking | 17 | 22,904 | 1,347 | 2.94% |
| Configuration Management | 8 | 6,819 | 852 | 3.78% |
| Certifications | 5 | 3,849 | 770 | 2.70% |
| Platform Engineering | 30 | 21,215 | 707 | 3.05% |
| Infrastructure | 78 | 53,875 | 691 | 3.15% |
| Observability | 37 | 23,818 | 644 | 2.79% |
| Data on Kubernetes | 3 | 1,871 | 624 | 1.92% |
| Resource Optimization | 12 | 7,061 | 588 | 2.76% |
| Security | 33 | 18,810 | 570 | 1.61% |
| Development | 15 | 6,479 | 432 | 2.89% |
| Edge & IoT | 2 | 495 | 248 | 0.61% |
What this says about readers:
- Networking has, for the first time since this report began, topped the charts with 1,347 impressions per content piece.
- In terms of total volume and CTR, the pattern is familiar: Infrastructure draws the most impressions, while Configuration Management leads on CTR at 3.78%.
- Readers clicked less in March than in February, with average CTR falling to 3.20% from 4.42% in February 2026.
How Reader Engagement Shifted (March vs February 2026)

How did click-through behavior change between the two months? (Excluding Edge & IoT due to low volume):
- Overall, readers clicked less month on month, with average CTR down to 3.20% from 4.42% in February.
- The biggest loss in CTR was for Platform Engineering topics (down by 3.52pp), followed by Observability (-3.44pp) and Resource Optimization (-2.15pp).
- The biggest gain was in Certifications, rising by 0.46pp to 2.70% CTR.
Readership by Brand

Engagement patterns across brands haven’t changed much between March and February 2026:
- Readers still favor architecture content. KubeArchitect drew 440,000 impressions, and engagement dipped by only 5%.
- Readers engage more consistently with tool-focused K3S posts than with Careers, Events, and Podcast posts, likely because tooling topics apply to a wider audience.
Cloud-native audience seeks architecture content, particularly on LinkedIn
We publish architecture content exclusively under Kube Architect, which accounts for 38% of the total social media impressions across the LearnKube network - roughly 3x the average impressions per brand.

Architecture content is clearly in demand among the cloud-native audience, and readers also seem to prefer it on a particular platform.
62% of all impressions on LinkedIn come from KubeArchitect
For the LearnKube network's total LinkedIn impressions, 62.3% have come from KubeArchitect, 18.6% from LearnKube, 5.9% from K3S, and 4.3% from Kube Careers.

In essence, if you are a marketer or content creator, the cloud-native community wants more architecture content, and it is more likely to consume that content on LinkedIn. Prioritize architecture content there.
What Readers Clicked On Most

- It’s crystal clear: readers' attention is drawn most to tool overviews. Eight of the top ten pieces were tool overviews.
- Top examples were SK8r (31,843 impressions), kubectl-ai (18,770), Kaos (16,794), and Karpenter-Optimizer (12,919).
- A DevSecOps job post also reached ~15K impressions, reinforcing that career content performs when the role is highly relevant.
Most-Clicked Content (>4% CTR and above 5,000 impressions)
| Content | CTR | Total impressions | Clicks |
|---|---|---|---|
| kubectl-ai | 4.08% | 16,366 | 667 |
| sk8r: Kubernetes Dashboard Clone | 3.74% | 20,799 | 778 |
| Using Claude Code to Pilot Kubernetes on Autodock | 3.69% | 10,460 | 386 |
| Benchmark Suite for Gateway API Implementations | 3.67% | 5,116 | 188 |
| Hidden Kubernetes Bad Practices Learned the Hard Way During Incidents | 3.67% | 7,267 | 267 |
| Radar: Kubernetes visibility | 3.24% | 14,579 | 473 |
| Smart Scheduler: Intelligent Pod Placement for Kubernetes Cost Optimization | 3.19% | 7,142 | 228 |
| How We Turned a Forced OS Migration into a 30% Infrastructure Reduction | 3.17% | 6,617 | 210 |
| Kubey: Web-based Kubernetes Dashboard | 3.02% | 9,948 | 300 |
| How a Request Travels Through Kubernetes Using Gateway API and Istio (A Real Networking Story) | 2.96% | 6,420 | 190 |
What happens when we categorize the most-clicked content by topic?

The pattern is clear:
- Readers are not only drawn to tool overviews, they are also the most likely to click on them.
- 30% are walkthroughs, showing that the community prefers tutorials (with story arcs) over opinion pieces (which make up 20% of the best CTR content).
Key Trends
Platform Engineering demand did not sustain
In March, Platform Engineering topics slipped to fourth place in both total impressions and average impressions per post, while average CTR dropped 50% month on month.
CTR outperformance for Platform Engineering topics in February was an outlier.
Networking looks like a credible breakout topic
For the first time, Networking topics topped the content efficiency charts with 1,347 impressions per content piece - 36% higher than Configuration Management in second place.
Metrics from April will confirm if demand for Networking topics has sustained (or not).
Security job listings remained highly sought after
For the third month running, a DevSecOps position has appeared in the most in-demand list, confirming that job listings can also attract blockbuster attention for specific roles.
Job listings have consistently appeared on in-demand lists (both volume- and CTR-wise) for Q1 2026, signaling that readers value job vacancies as much as tutorials, tool overviews, and walkthroughs.
Tool overviews keep winning on reach and clicks
March confirms the outsized status of tool overviews in terms of both reader attention and clicks. A striking 80% of the best-performing content by volume and 50% of the highest-CTR content were tool overviews.
The cloud-native community is most drawn to tool overviews; the data shows that tooling sits at the top of the attention hierarchy.
What This Means
1. Twitter publishing strategy needs a reset
Signal: Reader engagement on Twitter is down 50% in Q1 2026 versus Q4 2025.
Implication: Twitter’s content distribution and engagement metrics have changed, warranting a new strategy that leverages these rollouts.
2. Networking content needs a higher editorial priority
Signal: Readers delivered a record number of impressions for the topic despite lower overall reach.
Implication: Readers are increasingly seeking Networking-focused Kubernetes content. This could be an emerging trend for the coming months.
3. Average CTR is down 25% month on month and needs investigation
Signal: Readers delivered a 3.20% average CTR across popular topic categories, the lowest for Q1 2026.
Implication: Prioritize in-demand topic categories and content formats to drive more clicks.
4. Security job listings deserve more exposure
Signal: Security job listings have been in the most in-demand list for the third month running.
Implication: Readers are actively seeking security-focused vacancies, and there is a need to scale or increase the frequency of such content across the network.
Conclusion
March 2026 closes out Q1 2026. It performed below Q4 2025, but it also clarifies what the cloud-native audience is actually looking for:
- Readers clicked less than they did in February, even though March still outperformed March 2025.
- Platform Engineering does not yet look like a sustained trend. It led CTR in February, but that strength did not carry into March.
- Networking could be a breakout topic category. It delivered its best-ever efficiency and strong volume at the same time. April will show whether that demand holds.
- Twitter has changed in two major ways: content discovery has shifted, and so has engagement measurement. We will keep tracking both in the April report.
Readers want more architecture content, and they prefer consuming it on LinkedIn. Meanwhile, changes in Twitter's platform dynamics have pushed us to re-examine our publishing strategy there.
Looking ahead, April should help us tackle Twitter's low-engagement problem. Next month, we will also confirm whether interest in Networking topics is durable or temporary. Watch for the next report as we shift focus toward news-, career-, and event-based content.