
Kubernetes Insights Report - May 2026
Published in June 2026
TL;DR: Every month, the LearnKube network (LearnKube, Kube Architect, Kubesploit, Kube Builders, Kube Events, Kube Careers, KubeFM, and Kube Today) curates and shares Kubernetes news, tutorials, and tools across social media. This report examines what readers engaged with most in May 2026: which topics drew interest, which content formats drove clicks, and what the data says about where the Kubernetes community’s attention is heading.
In May 2026, 1,660 pieces of Kubernetes content reached readers across multiple platforms, totaling 1.15 million views.
May performed the least of all months in 2026, but the decline reflects a mix of major platform changes and shifting topic trends (more on both later). The June 2026 trends report will summarize the changes we've made to our publishing strategy.
Executive Summary
Readership Dashboard — May vs April 2026
Readers viewed our content 1,150,060 times in May 2026 — 21% less than April 2026, 8% below the 2026 average so far, and 9.35% higher than May 2025.

Overall impressions fell by 21%, and content efficiency declined by 19%, but the drop wasn't entirely due to an inefficient publishing strategy.
Top 3 Readership Insights
- Networking topics demand has lasted — For the third month running, Networking ranked in the top two topic categories. It reached 20,000 plus impressions with a content efficiency of 897 impressions per post.
- May sparks demand for Observability content — Observability was the most sought-after content topic for May 2026, with more than 51,000 impressions.
- Data on Kubernetes keeps drawing the most clicks — CTR for the topic has risen 80% in the last 90 days.
Where Readers Found Content
Let’s look at where readers discovered content across platforms.

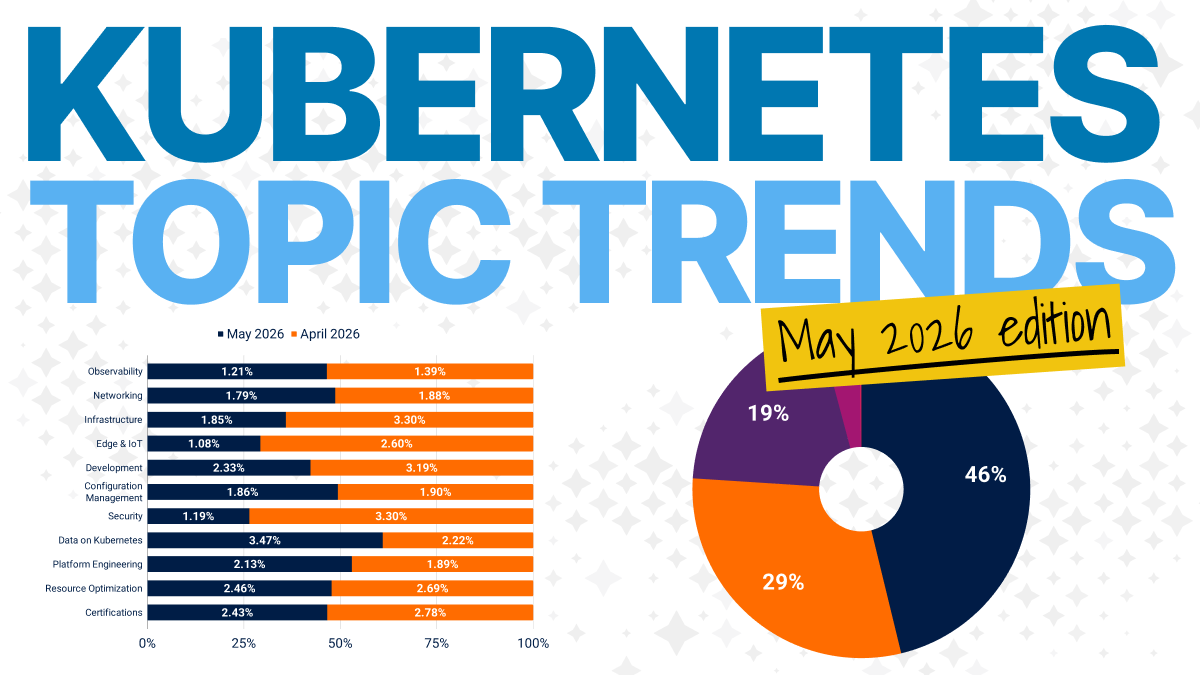
Readers encountered 46.2% of content on Twitter, 29.8% on Telegram, 19.8% on LinkedIn, and 4% on YouTube.
How did reader engagement vary across these platforms?

Platform performance remains consistent across the major platforms, except LinkedIn.
Month-on-month, platform impressions fell by 27%, and content efficiency dropped by 29% from April 2026.
The fall in LinkedIn engagement isn't due to an inefficient strategy or unpopular content.
LinkedIn 360Brew Foundational model + Feed SR recommendation system

Our LinkedIn publishing strategy remained unchanged and received a positive response in 2025, especially Q4 2025, but LinkedIn's full-fledged rollouts of its new recommendation system and AI-based foundational model, Feed-SR and 360Brew, appear to have affected our platform metrics.
LinkedIn's new feed system and recommendation mechanism now prioritize posts that seem 'professionally valuable' rather than standard metrics such as clicks and views.
Our June report will summarize the changes we've made to our LinkedIn publishing strategy to address these recent platform updates.
If you are a content creator or marketer in the cloud-native space, assess whether your publishing strategy for the platform needs a reset. Watch for our June 2026 report on how we are handling it.
What Topics Readers Cared About
May showed notable shifts in reader interest across topic categories.
| Categories | Content pieces | Total impressions | Average impressions per piece | CTR |
|---|---|---|---|---|
| Observability | 44 | 51,126 | 1,162 | 1.21%. |
| Networking | 23 | 20,634 | 897 | 1.79%. |
| Infrastructure | 75 | 66,029 | 880 | 1.85%. |
| Edge & IoT | 6 | 5,205 | 868 | 1.08%. |
| Development | 13 | 10,804 | 831 | 2.33% |
| Configuration Management | 9 | 7,274 | 808 | 1.86%. |
| Security | 45 | 31,861 | 708 | 1.19%. |
| Data on Kubernetes | 3 | 1,440 | 480 | 3.47% |
| Platform Engineering | 29 | 13,458 | 464 | 2.13%. |
| Resource Optimization | 3 | 975 | 325 | 2.46% |
| Certifications | 3 | 782 | 261 | 2.43%. |
What this says about readers:
- Observability was the most popular content category for May, with more than 50,000 impressions. The category has created intrigue going into June 2026. We'll wait for next month's data to confirm the trend.
- For the third month running, Networking topics have made it into the top two popular categories, confirming the subject is a trend!
- It's also notable that Configuration Management content slipped to sixth place for the first time in the last twelve months. This may signal a trend reversal for the topic category or just a blip, as content publishing volume was the lowest in recent history.
How Reader Engagement Shifted (May vs April 2026)

How did click-through behavior change between the two months? (Excluding Edge & IoT due to low volume):
- Overall, readers clicked less month on month, the least for any month in 2026, but almost in line with May 2025.
- The average CTR for May was 2.03%, down 15% from April (2.41%).
- The biggest CTR loss, and the main driver of the lower average CTR, came from Security content, down 2.11 pp in a month (a 64% drop), followed by Infrastructure (down 1.45 pp) and Development (down 0.82 pp).
- The biggest gain was in Data on Kubernetes topics, rising by 1.25 pp to a 3.47% CTR. This is the second month in a row that Data on Kubernetes topics has seen rising CTR.
Readership by Brand

Engagement patterns across brands changed only modestly from April to May 2026:
- Readers still favor architecture content. Kube Architect drew 331,096 impressions, and engagement remained highest at 2,628 impressions per post.
- Readers continue to engage more consistently with tool-focused K3s content than with Careers and Events. Our podcast brand, KubeFM, continued to rack up 100,000+ views and may overtake K3s' tool-focused content in June 2026.
What Readers Clicked On Most

- Tool overviews are a hit with the cloud-native audience! For the third month in a row, they have accounted for more than 70% of the highest-volume content.
- The most popular examples were Nelm, a touted Helm 4 alternative, garnering almost 20,000 views, followed by Crossview (15,017 views) and Ingress NGINX migrator (14,935 views).
- May 2026 broke the 2026 trend of featuring at least one role vacancy in the most popular content list; however, a high-paying Platform Engineer role still reached #13 in the popularity order, proving that vacancies attract cloud-native interest.
Most-Clicked Content (>2% CTR and above 5,000 impressions)
| Content | CTR | Total impressions | Clicks |
|---|---|---|---|
| Mount mayhem at Netflix: scaling containers on modern CPUs | 3.11% | 8,003 | 249 |
| k10s | 2.96% | 7,445 | 220 |
| Building Secure GitOps Pipelines: Integrating External Secrets Operator with ArgoCD on EKS | 2.79% | 5,230 | 146 |
| We brought Skew Protection to your Kubernetes | 2.40% | 6,174 | 148 |
| Teleskopio | 2.22% | 8,293 | 184 |
| Running PostgreSQL on Kubernetes: Operators, Storage and Production Guide | 2.18% | 8,205 | 179 |
| Designing for Failure with CloudNativePG | 2.09% | 5,013 | 105 |
| I Added Prometheus, Grafana, and Custom Alerting to My EKS Cluster, Here's How Observability Actually Works | 2.08% | 10,753 | 224 |
What happens when we categorize the most-clicked content by topic?

Here are the key takeaways:
- While April featured 50% walkthroughs in the most-clicked list, May went to 75%! Barring two tool overviews, eight of the most clicked content on the network were Walkthroughs.
- These weren't the ordinary kind, but ones with story arcs and strong titles, leading with Mount mayhem at netflix: scaling containers on modern cpus getting 8,000 plus impressions and a 3.11% CTR.
Key Trends
Observability shows breakout potential
Despite lower overall volume, Observability topics garnered 51,126 impressions, with an impressive efficiency of 1,162 impressions per post.
The cloud-native audience has shown peak interest for Observability in May 2026, the numbers from June will confirm if it breaks out into a trend
LinkedIn rolls out massive platform changes
With the lowest platform volume for the network so far in 2026, a month-on-month 27% decline, and a content efficiency drop of 29%, the changes in LinkedIn models have affected the network's content performance.
With massive platform-level changes from LinkedIn, the publishing strategy needs a rejig. June 2026 data will confirm the effects
Networking is a trending topic
For the third month running, Networking made it to the top two most popular topic categories, with 20,000 plus impressions and a content efficiency of 897 impressions per post.
With over 75,000 impressions and an average efficiency of 1,200 impressions per post in the last 90 days, there is no doubt that the cloud-native community is seeking Networking content.
Data on Kubernetes topics attract the most clicks
May 2026 marks the third consecutive month of rising CTR for Data on Kubernetes topics. March (1.92%) > April (2.20%) > May (3.47%).
The topic category has drawn the most clicks in the last 60 days, signaling where the cloud-native community's clicks are headed.
Configuration management content loses traction
With the least volume, efficiency, and CTR in the last twelve months, Configuration Management topics have plummeted in performance for May 2026.
The cloud-native community has always sought Configuration Management content. We may be seeing a change in the audience's content preferences, or it could be a one-off. Only June will tell.
What This Means
1. Increase Observability content frequency for June 2026
Signal: Reader engagement on the topic peaked in May 2026. Observability hit 51,000 plus impressions, with content efficiency of 1,162 impressions per piece.
Implication: Readers are increasingly seeking Observability-focused Kubernetes content. This may turn out to be a trend heading into Q3 2026, or it may just not last into June 2026.
2. LinkedIn metrics hit massively with the Platform rollouts. Rejig needed.
Signal: May 2026 registered the lowest volume, efficiency, and CTR for LinkedIn content so far this year. Impressions down 27%, efficiency down 29% month-on-month.
Implication: Need to analyze the new foundational models for LinkedIn. The publishing strategy, including the content formats, needs to change based on the analysis results.
3. Leverage Networking content
Signal: Made it to the top two of popularity lists for the third month running. The cloud-native community regularly seeks Networking content.
Implication: Scale Networking-focused content across the brands.
4. Analyze Configuration Management content performance in June
Signal: Worst performance for the topic in the last twelve months. Trend reversal could be on the cards.
Implication: Analyze how Configuration Management content performs across the network. If it struggles to perform in June, it will receive lower priority heading into Q3 2026.
Conclusion
May 2026 marks a key step for the rest of 2026. The trends analyzed for the month will help set up a better-performing Q3 2026. The month's reports further clarified what the cloud-native community seeks in 2026:
- Readers continued to seek Networking content, while being drawn towards Observability content for the first time ever in 2026.
- LinkedIn plays a major role in the network's performance, and thus needs immediate amendments to not lose ground for the rest of Q2 2026 as we head to the third quarter of the year.
- Lack of performance from Configuration Management topics does raise a flag, which could mean the cloud-native community isn't seeking the content category anymore, or we may see it back in the trend for June 2026.
Readers want more networking and observability content, and their preferred formats are walkthroughs with story arcs. Meanwhile, we are keeping a close eye on Data on Kubernetes topics, which continue to draw clicks.