
The Hidden Cost of Kubernetes: Resource Management in 2025
Published in November 2025
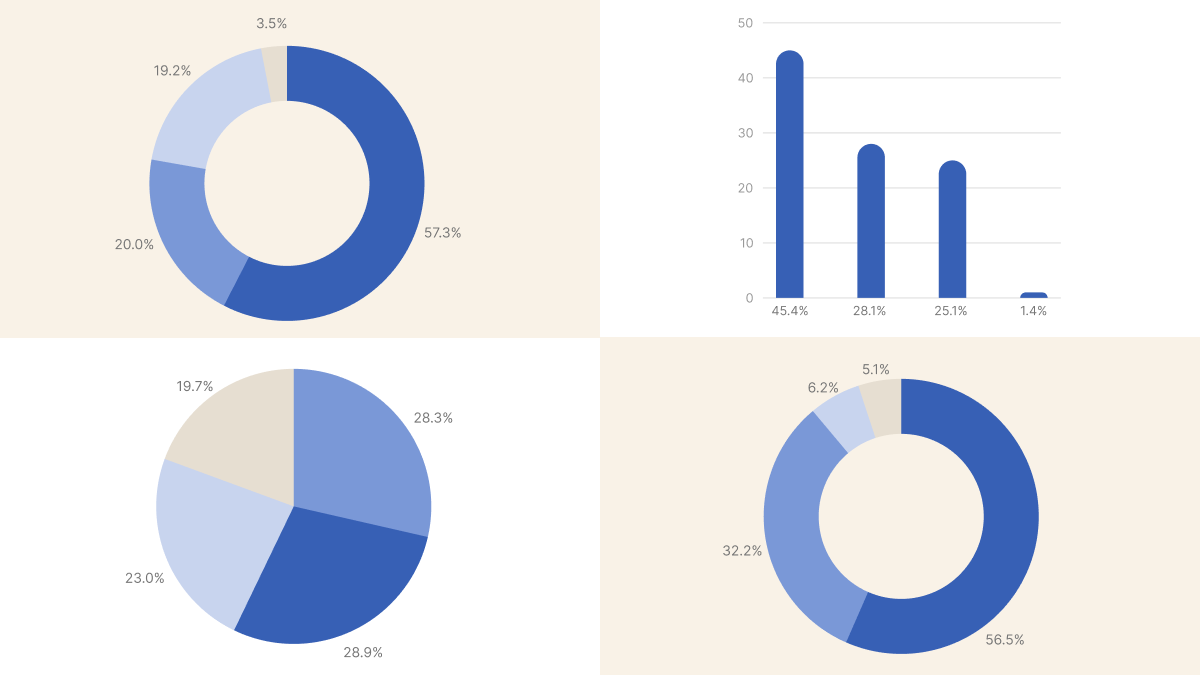
TL;DR: How does the Kubernetes community manage resource requests and limits? We asked 1,317 practitioners. Most want automation (57% pursue continuous optimization), but most still do it manually (56%). Nearly half suffer from CPU throttling and OOM kills.
Resource management in Kubernetes remains a fundamental challenge that sits at the intersection of cost control, application performance, and developer autonomy.
While the mechanics of setting requests and limits are well-documented, the practical approaches teams take vary widely.
Disclosure: StormForge sponsored this research. They provided the overarching theme but had no input on the actual questions or analysis.
This survey aimed to understand not only what teams do, but also why they do it and what trade-offs they're making along the way.
The data reveals a community split between automated optimization and manual management, with most teams acknowledging significant room for improvement in their resource utilization.
How Actively Do You Manage Your Kubernetes Requests and Limits?
We began by inquiring about management frequency to understand whether teams view resource configuration as a one-time setup or an ongoing practice. The question was deliberately framed around activity level rather than asking what teams "should" do.

The clear majority favors continuous optimization, though what this means varies significantly in practice.
Sandeep explained their reasoning: "underlying application dependencies and changes, client payload variations, and wire rate behavior are not consistent."
This reality applies across bare metal, hypervisors, and containerized infrastructure, making continuous optimization through automation necessary.
Tibo provided insight into a pragmatic middle-ground approach: most of their workloads are horizontally scalable, which lends itself to a set-and-forget strategy focused on thresholds.
For more fixed-size workloads, they periodically evaluate dashboards showing waste through utilization percentages or unused CPU and memory totals per namespace and workload.
While not fully automated, this dashboard-driven approach has proven sufficient, especially since optimizing large, scalable workloads delivers greater returns.
Several respondents mentioned specific tools: Arthur uses PerfectScale by DoiT, an automated platform that saves significant time on configuration.
Neeraj found Goldilocks effective, while Dawid tested both Goldilocks and krr with Robusta and is considering adopting them permanently.
From Twitter, Michael shared a detailed approach: setting requests to the mean of used resources over the past 24 hours to 3 days while removing limits entirely.
This works well for smaller environments with close workload control (under 100 deployments).
They maintain Grafana dashboards showing workloads with consistently less than 50% utilization and another for those exceeding 90%, adjusting requests to land around 70-80% utilization.
This approach particularly benefits workloads with short-lived spikes in memory or CPU, allowing the scheduler to accommodate those spikes without OOM kills or throttling, while avoiding wasted resources during normal operation.
What this means for you:
The high percentage choosing continuous optimization suggests the community recognizes that resource requirements change over time.
However, the gap between the 57% pursuing optimization and the actual tools available (discussed later) indicates many teams are implementing this manually.
If you're in the "set and forget" category, you're not alone, but consider whether your applications have truly stable resource patterns. Monthly reviews might be a practical middle ground between the overhead of automation and the value of optimization.
What's Your Biggest Kubernetes Resource Management Headache?
Understanding pain points helps contextualize the strategies teams employ.
We asked about the most pressing challenges teams face with resource management.

Runtime issues dominate the pain points, with CPU throttling and OOM kills affecting nearly half of respondents.
This suggests that when resource configuration goes wrong, it becomes immediately apparent.
Soumyadip confirmed this, noting that CrashLoopBackOff and OOM issues continue to create problems in daily Kubernetes cluster monitoring.
Vitaly identified a specific challenge for containerized Java applications: spikes caused by JIT compilations.
This represents a category of applications with predictable but extreme resource patterns that are difficult to accommodate with static configurations.
Logan provided a nuanced perspective on the OOM kill issue.
While OOM kills are manageable for managed memory runtimes, though not pleasant, they are avoidable.
The real nightmare emerges with auto-scaling, where finding the right balance between cost efficiency and load variance becomes particularly difficult, especially for API-accessible applications.
The organizational challenge of getting developers to set requests and limits resonates strongly at 28%.
This isn't just a technical problem but a cultural and process one.
One respondent, from Twitter, noted that in multi-tenant scenarios, requests and limits should be set at the namespace level, at a minimum, after consulting with developers, allowing them to take responsibility.
For dedicated clusters, there's more flexibility depending on the budget.
They suggest testing in pre-production environments to establish values close to 70% of actual production needs.
Dimitri raised an often-overlooked issue: the actual allocatable resources available on nodes.
System reserves always consume some CPU and memory, but finding reliable tables or calculators for these reserved resources proves difficult.
Engineers often set requests with round numbers, such as 4GB of memory, but this results in over-provisioned nodes, as a 4GB node typically offers only around 3.5GB as the maximum allocatable.
If you are interested in diving deep into the challenge, you might find this article I wrote and the Kubernetes instance calculator relevant.
From Telegram, Ezio highlighted another gap: explaining CPU throttling to developers remains a significant challenge in itself.
What this means for you:
If you're experiencing CPU throttling or OOM kills, you're in good company, as 45% of respondents report similar issues.
The data suggests that this is more common than obtaining accurate initial values, implying that many teams are learning through production incidents.
Consider implementing dashboards that surface utilization patterns before they become incidents.
For the organizational challenge, the comments suggest that ownership and responsibility need to be clearly defined rather than simply mandating that developers set values without understanding or visibility into the consequences.
How do you determine the correct resource values in Kubernetes?
After understanding the challenges, we asked about the methods teams use to establish resource values.

Production metrics dominate by a significant margin, with nearly 80% of teams relying on observed behavior rather than predictions or tool recommendations.
However, as noted in the poll introduction, even teams using production metrics often admitted they're essentially reviewing Grafana dashboards and adding 20% for safety.
Tobias from Telegram specified their approach: metrics from Prometheus plus a buffer.
This represents the practical reality for many teams using production metrics.
Emiliano shared a candid account of their ongoing struggle.
They tried letting Goldilocks set requests and limits, but found all resources had less CPU than necessary to start pods and run liveness and readiness probes.
Using Kubecost for a while helped establish baseline requests and limits, but the process consumed significant time without fully resolving the issues.
Their next step involves working with an APM to identify patterns for each microservice, though they acknowledge this will be challenging: their production cluster runs 130 microservices, all with more requests than needed and extremely high limits, resulting in clusters that are consistently 1000% overcommitted.
What this means for you:
If you're using production metrics, you're aligned with the vast majority.
However, the low confidence in tool suggestions (under 3%) and Emiliano's experience with Goldilocks highlight a significant gap: tools that generate recommendations often fail to account for the full lifecycle of applications, including startup costs and health check requirements.
When establishing values from metrics, consider not just average utilization but also startup patterns, traffic spikes, and the specific behavior of your application runtime (such as JIT compilation for JVM applications or garbage collection patterns).
What's your primary tool for managing Kubernetes resources?
Understanding which tools teams actually use provides insight into the maturity and adoption of resource management solutions.

**Manual management through kubectl and dashboards remains the most common approach, used by over half of the respondents. ****
This aligns with the earlier finding that teams use production metrics but suggests they're applying those insights through direct configuration changes rather than automated systems.
The VPA, HPA, and autoscaler category captures approximately one-third of respondents, although it's worth noting that this group includes various tools with different purposes.
HPA scales the number of pods based on metrics, while VPA adjusts the resource requests themselves.
This bundling in the poll options makes it challenging to determine which specific tools are most prevalent, but it does indicate that roughly a third of teams have adopted some form of automation.
Commercial solutions and custom-built tools each represent small but notable segments.
The low adoption of commercial solutions (just over 6%) despite the clear challenges identified in earlier polls suggests either cost barriers, integration complexity, or insufficient awareness of available options.
What this means for you:
The dominance of manual management suggests that automated resource optimization is still in its early stages of adoption.
If you're managing resources manually, you're in the majority, but you might benefit from exploring whether VPA in recommendation mode (not auto-apply) could inform your manual adjustments.
For teams already using autoscalers, consider whether you're measuring their actual impact on resource utilization versus just adoption metrics.
Who controls resource limits in your organization?
Ownership of resource configuration has a significant impact on how teams approach optimization.

The nearly even split between collaborative approaches and platform team control suggests this remains an area of active experimentation.
The relatively low percentage of pure developer ownership (under 18%) contrasts with the earlier finding that 28% of teams struggle to get developers to set requests and limits, suggesting many teams have shifted this responsibility rather than solving the engagement problem.
Slamp from Mastodon described a structured approach: a central team composed of architects, experts, and FinOps personnel defines recommendations for applications, including HPA, VPA, and manual tuning.
Application SREs implement these recommendations, while platform teams only handle cluster autoscaling.
This model aims to strike a balance between specialized expertise and application context.
What this means for you:
The lack of a clear winning model suggests that ownership should be adapted to your organization's size, culture, and technical maturity rather than following a universal best practice.
The high percentage of collaborative approaches suggests that neither pure centralization nor pure decentralization is without significant drawbacks.
Consider whether your current model provides clear accountability for resource waste and performance issues, and whether the people making decisions have both the necessary context and the right incentives.
What percentage of your Kubernetes compute costs could better resource management save?
The final poll aimed to quantify the opportunity cost of current resource management practices.

The responses are distributed relatively evenly across all categories, with slightly more teams acknowledging significant waste (over 40%) than claiming strong optimization.
Nearly 20% of respondents have no visibility into potential savings, which represents a substantial blind spot.
Douglas acknowledged their response was a guess to meet the poll deadline, but offered several testable hypotheses: most over-provisioning occurs in underloaded non-production environments; cost is more optimized outside the cluster than inside; more than half of main containers request 1 CPU or more; and more than half of main containers don't actually need to reserve 1 CPU.
Richard highlighted a nuanced challenge: even with rightsized memory for services, nodes can run out of memory while the CPU sits idle.
This requires working with service engineers to select appropriate node types and revisit sizing over time for optimization.
Notably, application teams do not typically adopt KubeCost's CPU container rightsizing recommendations in these cases.
What this means for you:
If you're in the "no idea" category, you're not alone, with nearly 20% of respondents sharing the same sentiment.
However, this represents an opportunity.
Start by establishing visibility into actual versus requested resources for your top 10 or 20 workloads by cost.
For teams aware of waste but not acting on it, the data suggests the barriers are likely organizational or procedural rather than technical.
The relatively even distribution across all waste categories suggests there's significant potential for improvement across the industry, not just among teams that haven't yet addressed resource management.
Summary
The 2025 survey of Kubernetes resource management reveals a community in transition.
While 57% of teams pursue continuous optimization, the dominance of manual management tools (56%) suggests this optimization is largely human-driven rather than automated.
The primary pain points remain operational: CPU throttling and OOM kills affect 45% of teams, indicating that resource configuration frequently fails under production conditions rather than failing gracefully.
Production metrics have won as the preferred approach for determining values, with 79% relying on observed behavior.
However, only 32% have adopted automated tools like VPA or HPA, and just 6% use commercial solutions, pointing to a significant gap between intent and implementation.
Organizationally, no clear winner has emerged in ownership models, with teams nearly evenly split between collaborative approaches (41%) and platform team control (38%).
The cost-impact data suggests a substantial opportunity: 57% of teams believe they could save 20% or more through better resource management, with 29% identifying savings potential above 40%.
Yet nearly 20% have no visibility into their potential savings at all.
These patterns suggest that while the community understands the importance of resource management, the tools and processes for doing it effectively remain immature.
Teams are broadly managing resources in the same way they did during the VM era: through periodic manual reviews, educated guesses, and a healthy safety buffer.
The gap between stated optimization goals and actual automation adoption represents both a challenge and an opportunity for the ecosystem to develop better solutions that account for the full complexity of production Kubernetes workloads.