
Kubernetes Insights Report - September 2025
Published in October 2025
TL;DR: This report examines the September 2025 content performance across the LearnKube network (LearnKube, Kube Architect, Kubesploit, Kube Builders, Kube Events, Kube Careers, KubeFM and Kube Today), comparing key metrics with August 2025 to identify trends and optimization opportunities.
During September 2025, we published 1,333 content pieces across multiple platforms, generating almost 1.5 million social media impressions.
Since the overall volume decreased by 3.22% from August's 1,376 content pieces, the total impression declined ever so slightly by 6.62%.
Executive Summary
Key Performance Dashboard - September vs August 2025
Since we published fewer posts in September (3.22% less) vis-à-vis August, the total impressions were slightly down by 6.62% while the average engagement decreased by just 3.29%.

Top 3 Data-Driven Insights
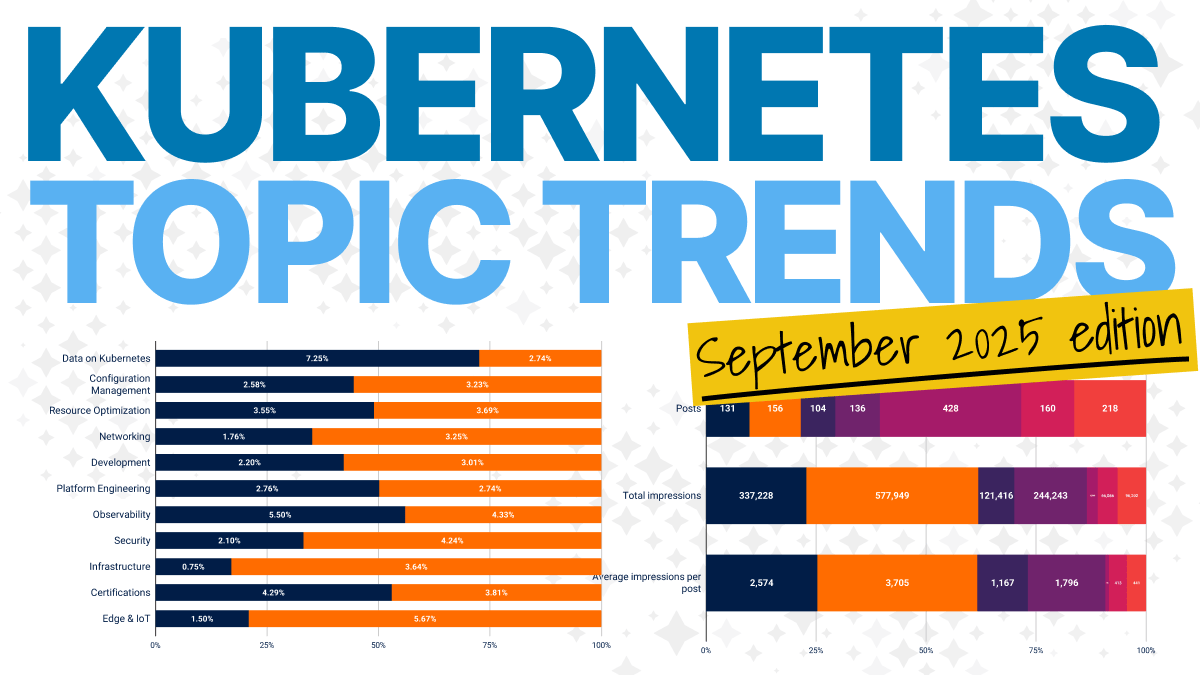
- Data on Kubernetes content achieves highest CTR + highest average impressions - 7.25% CTR + 7,433 Avg impressions.
- Observability shows strong CTR improvement - +0.80pp vs August, indicating growing audience interest.
- Tool overviews drive most engagemet - 40% contribution to the highest CTR content + Average CTR of 7.42%.
Volume & Reach Analysis
Let's examine the content performance in relation to popular social media platforms.

38.9% of all our posts were published on Twitter (given the short-form nature of the platform), while 31.1% were on Telegram, and 26.9% were on LinkedIn.
While YouTube accounted for 2.6%, Spotify accounted for just 0.5% of the total posts.
Let's examine the performance metrics for all posts across the various platforms.

With the above statistics, LinkedIn has the highest average impressions per post at 2,090, Twitter at 1,089, Telegram at 379, Youtube (239), and Spotify (160) wrapping up the list.
Platform Evolution - September vs August 2025
LinkedIn has been the most efficient platform for Kubernetes content in the previous months as well.
To implement this trend into our strategy, we reduced our Twitter content by 20% and increased the content on LinkedIn and Telegram by 5% and 8%, respectively, for September 2025.

To better understand the current efficiency of content across platforms, let's compare the average impressions per post for August and September 2025.

As can be seen, apart from the 8-9% decrease in average impressions for LinkedIn in September compared to August, there have been no significant changes.
Since the base numbers for YouTube and Spotify are low, the change in the metric for these platforms isn't conclusive.
Content Category Deep Dive
Although low in the number of pieces published, DoK content has achieved the highest average impressions and the most CTR.
| Category | Pieces | Total impressions | Average impressions per piece | CTR |
|---|---|---|---|---|
| Data on Kubernetes | 7 | 52,033 | 7,433.29 | 7.25% |
| Configuration Management | 38 | 191,734 | 5,045.63 | 2.58% |
| Resource Optimization | 28 | 109,832 | 3,922.57 | 3.55% |
| Networking | 42 | 146,174 | 3,480.33 | 1.76% |
| Development | 43 | 119,100 | 2,769.77 | 2.20% |
| Platform Engineering | 49 | 114,164 | 2,329.88 | 2.76% |
| Observability | 27 | 52,872 | 1,958.22 | 5.50% |
| Security | 42 | 80,344 | 1,912.95 | 2.10% |
| Infrastructure | 120 | 184,769 | 1,539.74 | 0.75% |
| Certifications | 2 | 536 | 268.00 | 4.29% |
| Edge & IoT | 1 | 266 | 266.00 | 1.50% |
The key takeaways from the analysis are:
- While the trend may not be completely conclusive due to lower posts being published, Data on Kubernetes (DoK) content brought in the most efficiency at 7,433 impressions per piece while also exhibiting the highest CTR we've ever recorded for a category in the past six months: 7.25%.
- Configuration management topics had the highest impressions at 191,734, an outstanding average of 5,045 impressions per piece, and a decent CTR for the sheer volume of the content.
- A category with average impressions but the second highest CTR was Obervability with 5.50%, while Resource Optimization garnered a 3.55% CTR and a good average impressions number (3,922).
CTR Performance Comparison (September vs August 2025)

There appears to be quite a change between the two months, so let's break it down further.
As the volume is low to begin with, we'll ignore statistics for DoK, Edge & IT, as well as certification-based content.
If we look at the other topics, here are the key changes:
- Observability has shown the most positive change, with a 1.17pp CTR difference month-on-month.
- Some of the topics that have lost the most efficiency are:
- Infrastructure topics, which declined by almost 3pp (some of it can be attributed to our change in strategy for the topic, as it was losing audience demand)
- Security topics surprisingly have gone down by 2.14pp in terms of CTR, while Networking and Development lost traction by 1.50pp and 0.79pp in a span of 30 days.
- What's also noteworthy is how, despite all the changes in CTR metrics for most of the topics, Resource Optimization content has maintained CTR performance month-on-month, despite being in the highest volume bracket (109,832 impressions).
Account Performance Analysis

Note: Account performance appears steady across all accounts.
Let's divide the analysis for this section into two parts.
Part 1: Educational content > Event,jobs, podcasts.
- If we look at the numbers, Educational / News / Architectural content that comes from our brands: LearnKube, KubeArchitect, K3s, and Security make up for just 39.5% of the total posts published yet in total, they garner 86.5% of the total impressions.

Part 2: Architectural content reigns supreme
- Amongst our brands, the highest efficiency is garnered by Kube Architect with a staggering efficiency of 3,705 impressions per post, the hierarchy for the same metric then goes: LearnKube > Security > K3s > KubeFM > Kube Careers > Kube Events
- What's even more interesting is how KubeArchitect alone brought in 39.05% of the total impressions.
While we can't expect the same level of efficiency from our brands, Kube Events, Kube Careers, and KubeFM, there needs to be an evaluation of the extent to which we can expand their reach.
Top Content Performance Analysis
Highest Volume Content (>15k impressions)

The content piece with the highest impressions in September 2025 turned out to be a Helm chart overview that provides a plug-and-play deployment of vsftpd for exposing FTP in Kubernetes with 22,971 impressions. It was followed by a Configuration Management piece on using Helm Charts in Production with 21,985 impressions.
These were followed by Our collaboration page with Testkube (20,224), an overview of Pangolin: a self-hosted tunneled reverse proxy server (17,200), and an article on if you Can Run a MariaDB Cluster on a $150 Kubernetes Lab (16,646).
While these content pieces had the most impressions, the CTR hierarchy was a little different.
Highest CTR Content (>7.5%)
| Content | CTR | Impressions | Clicks | Category |
|---|---|---|---|---|
| Autoscaling Kubernetes Pods Based on HTTP Traffic | 19.47% | 1952 | 380 | Tutorial - Resource Optimization |
| Mastering Kubernetes Security: A Deep Dive into SecurityContext | 10.92% | 3188 | 348 | Tutorial - Security |
| kubectl-browse-pvc | 10.77% | 1894 | 204 | Tool overview (Plugin) |
| More devops than I bargained for | 9.63% | 1962 | 189 | Case study |
| Everything was fine until Kubernetes said 'No more CPU' | 8.96% | 7169 | 642 | Case study |
| Offensive Container Security: Techniques, Misconfigurations, and Attack Paths | 7.25% | 1103 | 80 | Insight - Security |
| SecretForge — A Sidecar for Kubernetes Secrets | 6.81% | 1263 | 86 | Tool overview (Application) |
| Fine-grained control with configurable HPA tolerance | 6.49% | 2280 | 148 | Feature Insight |
| Kubernetes Prometheus Analyzer: CLI for Resource Optimization | 6.19% | 2696 | 167 | Tool overview (CLI tool) |
| BYOC Kubernetes on a Single VPS with Kubee | 5.95% | 1663 | 99 | Tool overview (hosting platform) |
It gets really interesting if we categorise the highest CTR content according to its category and sub-categories.

The key takeaways here are:
- Tool overviews attract the most clicks.
- Case studies, tutorials, and articles with signature opinions are also in demand.
- Interestingly, the best performing topics are validated in the top CTR list, as most of the content falls in Resource Optimization and Security.
Key Trends and Insights
September 2025 data signals great performance from Data on Kubernetes (DoK) content.
Highest average impressions for any topic in the last six months, while also exhibiting the highest CTR for any topic during the same period, and all of this within a good base of impressions (50,000+)
Tool overviews = CTR Magnet
While hands-on, tutorial/walkthrough content has done well across our brands, the data from September 2025 reveals that tool overviews perform better.
40% of the best CTR content consists of tool overviews, and the average CTR for such content stands at 7.42% (among the best-performing content).
Helm charts content attracts high volume
While content related to Helm charts was also popular in previous months, it has reached a new high in September.
The two content pieces, in terms of sheer volume, are based on Helm Charts, which account for a total of 45,000 impressions and 597 clicks.
Average CTR for most topics is down vis-à-vis August 2025
While we've always had an average deviation of 0.10-0.30pp in CTR across topics, September has turned out to be an exception, and not in the best way.
If we exclude outright CTR performers such as DoK and Observability, the average CTR for 70% of the topics has gone by 0.50-3.00pp month-on-month.
Personal experience pieces > Data-based content
While raw data can be used to analyze and identify current trends, content derived from engineers' personal experiences tends to draw more attention.
Excluding tool overviews, 60% of the top-performing CTR content comes from articles that channel personal insights/learnings from experiences, garnering an average of 8.22% CTR (among the best-performing content)
Strategic Recommendations
1. Test increased frequency for Data on Kubernetes content
Data: Highest efficiency for a topic in the last six months (7,433) + Highest CTR for any topic in the same period (7.25%)
Action: Increase content volume for the topic. If the performance matches the numbers from September, we can confirm the audience demand for the topic.
Priority: High - Best performing category.
2. Love/hate relationship with Helm Charts
Data: Top 2 Highest volume pieces were Helm Charts topics, averaging 22,500 impressions amongst them.
Action: Identify if the current content schedule has Helm Charts-based content. If not, add these.
Priority: Medium - proven high-engagement topic.
3. Leverage Tool overviews
Data: 40% of the best CTR content is tool overviews. Average CTR is 7.42%.
Action: Increase frequency of content around tool overviews/news/updates.
Priority: High - Most in-demand sub-category of content
4. Prioritise content pieces derived from personal experiences/mishaps/discoveries
Data: 60% best performing content comes from this sub-type. Top posts average >8% CTR.
Action: Discover, Embed, Schedule more of this type of content.
Priority: Medium - Audience favourite sub-category.
Conclusion
- September 2025 has raised a few questions in terms of the topic/format/sub-categories trend. Data from October 2025 will clear the air.
- The month's results validate implementation of learnings from previous reports, such as increasing the publishing frequency for LinkedIn content while reducing the same for Twitter.
- The sudden rise in interest for Data on Kubernetes (DoK) content suggests we may be heading towards the storage layer (or maybe it's just a blip)
Meanwhile, Observability content is catching audience interest, and Resource Optimization continues to be one of the most consistently demanded topics.
Strategic Implications: Content creators and marketers should capitalize on high-performing categories while also exploring ways to include more experience-driven content.
Looking Forward: Interest in Data on Kubernetes topics provides a good opportunity to scale content on the topic. While working on content formats such as tool overviews, personalized insights may prove beneficial.