
Kubernetes Insights Report - October 2025
Published in November 2025
TL;DR: This report examines the October 2025 content performance across the LearnKube network (LearnKube, Kube Architect, Kubesploit, Kube Builders, Kube Events, Kube Careers, KubeFM, and Kube Today), comparing key metrics with September 2025 to identify trends and optimization opportunities.
During October 2025, we published 1,263 content pieces across multiple platforms, generating over 1.56 million social media impressions.
Despite a 5.5% drop in volume from September's 1,333 pieces, total impressions rose by 5.45%.
Executive Summary
Key Performance Dashboard - October vs September 2025
Despite publishing 5.5% fewer posts in October, total impressions rose by 5.45% and average engagement surged by 11.32%.

October 2025 had the highest average engagement since July 2025

October delivered the strongest average engagement since July 2025, outperforming recent months by 5-11%.
Top 3 Data-Driven Insights
- Data on Kubernetes content achieves highest efficiency - 5,537 impressions per post.
- Observability tops CTR list - 3.77% CTR in October. Was second best (5.50%) in September
- Tool overviews drive most engagemet - 40% contribution to the highest CTR content + Average CTR of 3.20%.
Volume & Reach Analysis
Let's examine the content performance in relation to popular social media platforms.

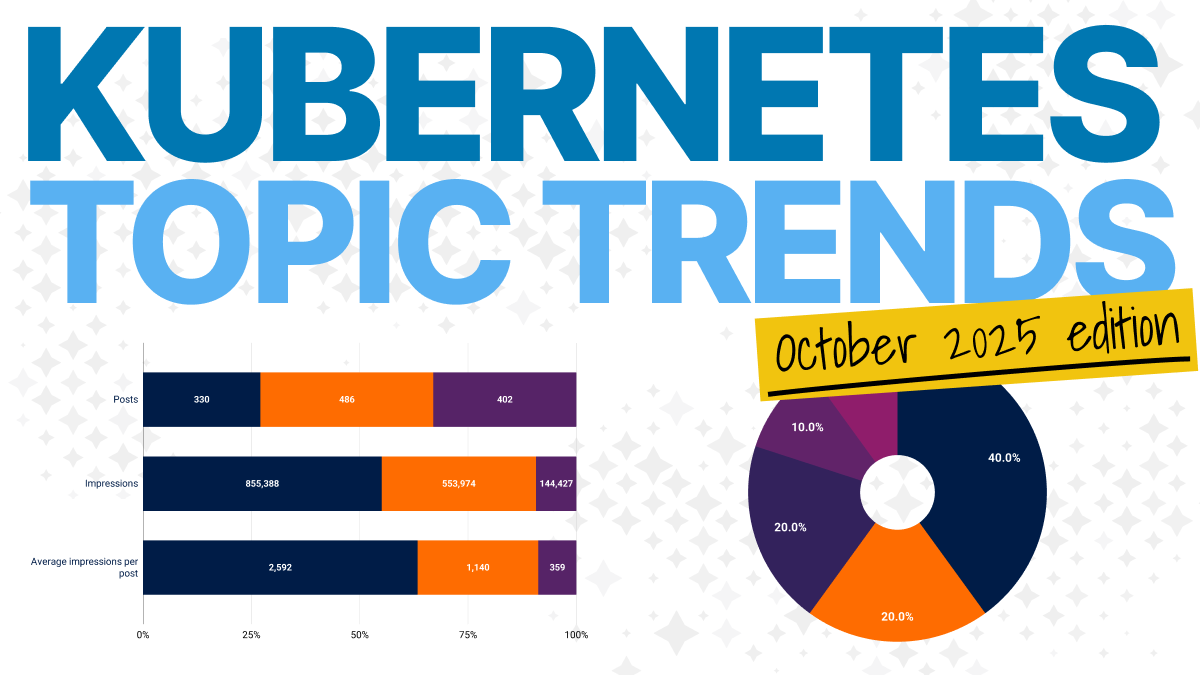
38.5% of all our posts were published on Twitter (given the short-form nature of the platform), while 31.8% were on Telegram, and 26.1% were on LinkedIn.
While YouTube accounted for 3%, Spotify made up just 0.6% of the total posts.
Next, let's review performance metrics for each platform to see how their results differ.

Among the popular platforms, LinkedIn has the highest average impressions per post at 2,592, Twitter at 1,140, Telegram at 359, Youtube (164), and Spotify (143) wrapping up the list.
Content Category Deep Dive
For the second consecutive month, Data on Kubernetes (DoK) is the most efficient topic category.
| Topic category | Pieces | Total impressions | Average impressions per piece | CTR |
|---|---|---|---|---|
| Data on Kubernetes | 14 | 77,516 | 5,537 | 2.61% |
| Resource Optimization | 34 | 185,345 | 5,451 | 2.50% |
| Configuration Management | 39 | 173,355 | 4,445 | 3.13% |
| Platform Engineering | 52 | 218,721 | 4,206 | 2.64% |
| Networking | 37 | 125,242 | 3,385 | 3.52% |
| Infrastructure | 113 | 316,638 | 2,802 | 3.26% |
| Observability | 31 | 66,150 | 2,134 | 3.77% |
| Development | 34 | 53,567 | 1,576 | 2.99% |
| Security | 34 | 48,234 | 1,419 | 2.82% |
| Certifications | 2 | 739 | 370 | 2.57% |
| Edge & IoT | 4 | 1,159 | 290 | 2.07% |
The key takeaways from the analysis are:
- Data on Kubernetes content led efficiency with 5,537 impressions per post for the second consecutive month, turning September's interest into a trend.
- Volume wise the hierarchy starts with Infrastructure (316,638) > Platform Engineering (218,721) > Resource Optimization (185,345).
- What's interesting to see is Observability topics had the highest CTR (3.77%), while the average CTR for all topics (excluding Certifications and Edge & IoT) stands at an impressive 3.13%.
CTR Performance Comparison (October vs September 2025)

A notable change between the two months warrants further breakdown.
As the volume is low to begin with, we'll ignore statistics for DoK, Edge & IT, as well as certification-based content.
Here are the key changes worth noting:
- CTR for Data on Kubernetes decreased by 5.40pp, but rose by 2.50pp for Infrastructure and 1.76pp for Networking. The average CTR for the two months differed by just 0.14 percentage points, despite apparent variance.
- Interestingly, Observability which was a trending topic for September, suffered a 1.90pp loss in CTR, while Security and Development gained it by 0.70-0.80pp month-on-month.
Account Performance Analysis

We'll discuss the key trends we've observed in the performance of our accounts.
The dominance of Architectural content in the Learnkube media universe.
Kube Architect, focusing on development, software architecture, and software development lifecycle, has shown high demand for this content type in recent months.

Kube Architect's average impressions per post have consistently increased, while maintaining an impressive volume of between 560k and 570k impressions per month.
Month-on-month, Efficiency for Kube Architect has increased by 4%.
The Kubernetes community has caught on with the Podcast fever.

KubeFM, our podcast, continues to gain audience, highlighting demand for podcast content.
While month-on-month KubeFM's total volume (of impressions) has increased by 4.5%, it has risen by 20% when compared to the numbers back in July 2025.
Top Content Performance Analysis
Highest Volume Content (>15k impressions)

- The top content in October 2025 was a Golang Tool - Kor overview (for unused Kubernetes resources), earning 77,510 impressions.
- Next was Kite, a lightweight Kubernetes dashboard, with 42,474 impressions, followed by FaaS (22,934), a deployment tool, and K3k (22,081), a multitenancy solution.
All four top pieces, with the highest volume, were tool overviews, totaling 164,999 impressions.
While these content pieces had the most impressions, the CTR hierarchy was a little different.
Highest CTR Content (>7.5%)
| Content | CTR | Impressions | Clicks |
|---|---|---|---|
| Kubernetes observability from day one - mixins on Grafana, mimir and alloy | 13.38% | 2003 | 268 |
| Introducing Gateway API Inference Extension | 12.16% | 1415 | 172 |
| Argo CD Diff Preview | 9.65% | 2497 | 241 |
| Raspberry Pi K8S Cluster Setup for Home Lab with Cilium | 8.55% | 1942 | 166 |
| How We Migrated 30+ Kubernetes Clusters to Terraform | 8.01% | 2134 | 171 |
| K8s cleaner | 7.94% | 3714 | 295 |
| Troubleshooting packet drops in a Kubernetes-based observability platform | 7.75% | 7309 | 551 |
| Kubech: Kubernetes context manager | 7.54% | 1048 | 74 |
| KubeBuddy | 7.06% | 2255 | 158 |
| Non-HA Kubernetes Gotchas: Downtime and Autoscaling Pitfalls with Single Replica Workloads | 7.01% | 1807 | 123 |
It becomes fascinating when we categorize the highest CTR content by category and subcategories.

The key takeaways here are:
- Tool overviews = CTR magnets. The best performing category for the second month running.
- Case studies and Walkthroughs come in with second-best CTR numbers. Highlighting why a plain tutorial isn't enough anymore unless you bring in a personal perspective/opinion to the content.
- Since the announcement content was an official Kubernetes release, it received such a high CTR.
Key Trends and Insights
October 2025 confirms demand for Data on Kubernetes (DoK) content
A topic curiosity that intrigued in September has now been confirmed as a trend with October data.
Most efficient topic for the second month running, while the total impressions have increased by almost 40% month-on-month.
The Cloud-native/Kubernetes community has caught the Podcast fever
While hands-on tutorials, walkthroughs, and tool overviews make for good reads, the audience yearns for Podcast videos - essentially not full podcast episodes, but shorter clips that articulate an opinion. A detailed review of podcast content will be included in our November 2025 report.
KubeFM, our podcasting brand, has now made 100k+ impressions for the second consecutive month, indicating even better numbers in the coming months.
Observability content = High CTR
While Observability content had the second-highest CTR (5.50%) in September, it has now taken the number-one spot (3.77%) in October, with a volume of 66,150 impressions.
As we increase the frequency of content for this topic, we'll understand if it can translate into a high-volume and high-efficiency topic.
Resource Optimization and Configuration Management are almost evergreen topics
For every month over the past six months, either one of these topics has ranked in the top two on the most efficient list. Highlighting the consistent demand for the topic content.
If we average the impressions for these topics in the last six months, it comes out to be an impressive 164,276 for Resource Optimization and 145,209 for Configuration Management.
Strategic Recommendations
1. Double down on Data on Kubernetes (DoK) content
Data: Highest efficiency topic for the second month in a row. 40% increase in impressions month-on-month. Action: Increase the frequency of content for the topic. Priority: High - Best performing category.
2. Leverage Podcast fever
Data: 100k+ impressions for KubeFM for the second month running. Action: Identify the best-performing formats (e.g., shorter video, segmentation) and increase their volume. Priority: High - proven high-engagement content format.
3. Test Observability content potential
Data: Highest CTR among all topics for October 2025. It was the second-highest for September 2025. Action: Increase content volume, test performance with different content formats. Priority: Medium - High CTR topic.
Conclusion
- Data from October has clarified the trends for Data on Kubernetes and Observability content.
- The data validates how efficiency increases when one implements the learnings from content analysis, highlighted by a 15% increase in our LinkedIn impressions (which is massive for a 500K impressions base).
- Architectural content makes up more than 1/3rd of our total brand impressions, which tells us what kind of content clicks with the audience.
Meanwhile, Observability content is a new entrant, while demand for Data on Kubernetes is a trend; resource optimization and configuration management are regular attendees on the most in-demand topics list.
Strategic Implications: Content creators and marketers should prioritize LinkedIn as a publishing platform, explore the podcasting realm, and Leverage Data on Kubernetes as an emerging topic trend, while testing the waters with Observability.