
Kubernetes Insights Report - November 2025
Published in December 2025
TL;DR: This report examines the November 2025 content performance across the LearnKube network (LearnKube, Kube Architect, Kubesploit, Kube Builders, Kube Events, Kube Careers, KubeFM, and Kube Today), comparing key metrics with October 2025 to identify trends and optimization opportunities.
During November 2025, we published 1,144 content pieces across multiple platforms, generating over 1.54 million social media impressions.
Despite a 9.42% drop in volume from October's 1,263 pieces, total impressions dipped ever-so-slightly (fell by a miniscule 0.89%) month-on-month.
Executive Summary
Key Performance Dashboard - November vs October 2025
November 2025 showcased strong audience retention as even though we published 10% fewer posts month-on-month, total impressions stayed almost consistent (only a 0.89% dip)
The lack of considerable decrease in total impressions points to an impressive rise in efficiency (average imppressions per post) – 9.41% vis-vis October 2025.

Between July - November 2025, the average engagement has risen by 17%!

With each month, we've tried to reflect our learnings from the previous months' trending topics report, which has resulted in a continuous increase in our average engagement numbers – translation – each month, we are becoming more efficient with our content strategy.
How efficient?
Between July and November 2025, the average engagement per content piece increased by a whopping 17% (a big change considering we are dealing with a base of 1.5+ million monthly impressions)
Top 3 Data-Driven Insights
- Observability content achieves highest efficiency - 4,836 impressions per post.
- Resource Optimization tops volume charts - Garnered a total of 208,161 impressions
- Walkthroughs / Case studies drive most engagemet - 80% contribution to the highest CTR content + Average CTR of 4.20%.
Volume & Reach Analysis
Let's examine the content performance in relation to popular social media platforms.

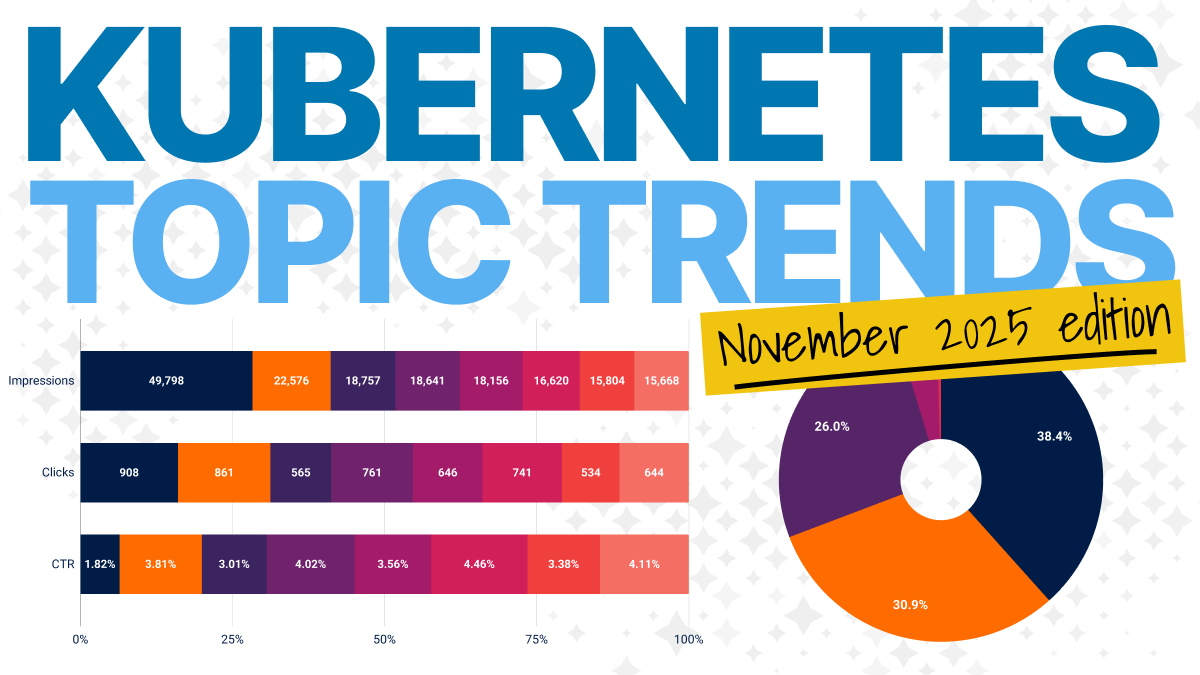
38.4% of all our posts were published on Twitter (given the short-form nature of the platform), while 30.9% were on Telegram, and 26% were on LinkedIn.
While YouTube accounted for 4.3%, Spotify made up just 0.4% of the total posts.
Next, let's review performance metrics for each platform to see how their results differ.

For the past six months, LinkedIn has led the platform stats in terms of total impressions, but Twitter has flipped the script for November, leading with 756,735 impressions (more on this later).
However, LinkedIn still tops the efficiency charts with 2,167 impressions per content piece.
Rise in Twitter impressions down to technical updates and not optimizations in content strategy

In November 2025, Twitter changed the way it dealt with tweets containing links. The update now loads a webview in the background every time a tweet with a link is viewed (you don't need to click on the link for the webview to be loaded).
The update resulted in a sudden increase in impressions for all Twitter (X) accounts. And like us, many, including the Substack CEO, thought it was our content strategy, which resulted in this massive gain!
Whether we like it or not, this update stays. Advice for marketers? Use the November 2025 metrics as a reference hereon(mainly impressions).
LinkedIn Video has arrived, and it is here to stay.
Videos on LinkedIn are finally gaining traction, and if you are contemplating whether or not to upload video content on LinkedIn, the data is saying you should!
We exclusively publish Video content on our podcast channel KubeFM, and we've observed that our LinkedIn impressions (for KubeFM) have increased multi-fold in 2025, and more so in recent months.
While we've used the same publishing strategy across all platforms for video, LinkedIn has emerged leagues ahead of YouTube – despite the latter being a dedicated video platform.

The key points to note here are:
- From July-November, our Youtube account for KubeFM received an average of 6,370 impressions per month, while the LinkedIn account received a whopping 23,749 average impressions per month, a difference of almost 400%!
- KubeFM LinkedIn views also hit an all-time high of 34,087 in October 2025 - highlighting the potential of good video content on LinkedIn.
LinkedIn has facilitated better Video on the platform, and the audience is now accepting of the format. Marketers, this is the right time to focus on LinkedIn Video.
Content Category Deep Dive
For the second consecutive month, Data on Kubernetes (DoK) is the most efficient topic category.
| Topic category | Pieces | Total impressions | Average impressions per piece | CTR |
|---|---|---|---|---|
| Observability | 42 | 203,119 | 4,836 | 3.26% |
| Resource Optimization | 46 | 208,161 | 4,525 | 3.21% |
| Platform Engineering | 40 | 175,479 | 4,387 | 3.72% |
| Data on Kubernetes | 40 | 173,500 | 4,338 | 3.74% |
| Networking | 50 | 198,536 | 3,971 | 3.09% |
| Infrastructure | 25 | 88,136 | 3,525 | 2.56% |
| Development | 33 | 88,672 | 2,687 | 2.84% |
| Configuration Management | 113 | 278,173 | 2,462 | 3.64% |
| Security | 41 | 76,422 | 1,864 | 3.89% |
| Edge & IoT | 3 | 1,372 | 457 | 7.00% |
| Certifications | 6 | 2,253 | 376 | 1.86% |
The key takeaways from the analysis are:
- November confirmed the trend for Observability, which was intrigued by good CTR numbers in October 2025. It has the best Average impressions per piece (4,836), 200,00 plus impressions, and a good average CTR number (3.26%).
- Volume-wise, the hierarchy is close at the top, and starts with Configuration Management (278,173) > Resource Optimization (208,161) > Observability (203,119).
- What's interesting to see is Security topics had the highest CTR (3.89%), while the average CTR for all topics (excluding Certifications and Edge & IoT) stands at an impressive 3.32% (a 10% increase month-on-month).
CTR Performance Comparison (November vs October 2025)

A notable change between the two months warrants further breakdown.
As the volume is low to begin with, we'll ignore statistics for DoK, Edge & IT, as well as certification-based content.
Here are the key changes worth noting:
- What's interesting to see is CTR for all the trending topics for October 2025: Data on Kubernetes, Platform Engineering, Resource Optimization, Configuration management, and Security, has increased in the range of 0.71-1.13pp, which is a result of our efforts in pushing the content for the month of November 2025.
- Interestingly, Observability which had the highest CTR in October, suffered a 0.51pp loss in CTR while Infrastructure which has already shown a decline in efficiency, declined by 0.70pp month-on-month.
- The average CTR for the two months differed by just 0.30 percentage points, despite apparent variance.
Account Performance Analysis

Note: Account performance appears steady across all accounts.
November is consistent with the account trends established in the previous reports for October 2025 and September 2025.
For the uninitiated, the following are the key trends reflected in the previous two months as well:
- Architectural content makes up for almost 33% of the total impressions recorded across all of our brands.
- Educational / News / Architectural content triumphs Event / Jobs / Podcast-based content, highlighting how the audience is mainly drawn towards learning.
Top Content Performance Analysis
Highest Volume Content (>15k impressions)

- Interestingly, the top-performing content (volume-wise) was a tutorial/walkthrough of how the author built a resilient FastAPI Architecture to Handle Traffic Spikes with Kubernetes Autoscaling and Gunicorn Workers, which garnered 49,798 impressions.
- Next was Kite, a lightweight Kubernetes dashboard, with 22,576 impressions, followed by KubeSphere (18,757) – a Kubernetes platform which was one of our sponsors, a tutorial on monitoring Kubernetes Cluster with Prometheus and Grafana using ArgoCD (18,641), and Freelens (18,156), a free IDE for Kubernetes.
This time, the top four content pieces were a mix of walkthroughs and tool overviews, which is a change from October 2025, when all the top content pieces were tool overviews.
Highest CTR Content (>7.5%)
| Content | CTR | Impressions | Clicks |
|---|---|---|---|
| Kubernetes: Finding Pathways Ebook | 44.29% | 1260 | 558 |
| How I find and fix Kubernetes Exit Codes and Misconfigurations for free | 21.96% | 1940 | 426 |
| Building Kubernetes (a lite version) from scratch in Go | 17.89% | 7312 | 1308 |
| KubeCodex: GitOps Repo Structure Template | 17.48% | 1482 | 259 |
| Optimizing node and pod startup performance | 13.84% | 1943 | 269 |
| Tuning Linux Swap for Kubernetes: A Deep Dive | 13.06% | 1401 | 183 |
| Achieving High Availability with distributed database on Kubernetes at Airbnb | 11.98% | 3239 | 388 |
| AI Infrastructure report | 11.67% | 3780 | 441 |
| header-vcluster | 9.90% | 1010 | 100 |
| Kubernetes Networking from Packets to Pods | 9.89% | 3871 | 383 |
Here are the key takeaways from analysing top CTR content for November 2025:
- Interestingly, our ebook launch post garnered an impressive CTR of 44% — a result of excellent copy, pre-launch polls, and distribution.
- What's even more interesting to see is how Case studies/ Walkthroughs made up for almost 80% of the top-performing CTR content.
Key Trends and Insights
November 2025 confirms demand for Observability content.
A topic curiosity that intrigued in October, with leading CTR numbers, has now been confirmed as a trend with November data.
Most efficient topic for the month, with a base of 200K plus impressions, and good CTR.
Twitter metrics have changed. November numbers to be used as the new benchmark
Since the way Twitter (X) registers an impression has changed (due to the preloaded webview for links), metrics, more specifically, impressions, will appear inflated when compared to pre-November 2025 numbers.
As of November 2025, this should now be used as a base for comparisons.
LinkedIn Video has arrived, and it's here to stay.
While traditional video platforms have done well for cloud-native content, Videos on LinkedIn are the next big thing, as the platform is now promoting the format, and the audience has developed an appetite for it.
Video impressions on LinkedIn touched an all-time high of 34,000 in October 2025, and have been in the range of 25,000-30,000 impressions in recent months.
Case studies / Walkthroughs receive the highest CTR
While producing walkthroughs and case studies is a time-consuming affair, the rewards are worth the effort.
For November 2025, the average case study or walkthrough content garnered a CTR in the range of 3.6%-7%!
Resource Optimization and Configuration Management content seems to never be not in trend.
For every month so far in 2025, Resource Optimization and Configuration management content has been in the top 2 for topic categories either in terms of efficiency or sheer volume.
If we average the impressions for these topics in the last six months, it comes out to be an impressive 164,276 for Resource Optimization and 145,209 for Configuration Management.
Strategic Recommendations
1. Double down on Observability content
Data: Highest efficiency topic for the month. Had the highest CTR in October 2025.
Action: Increase content frequency for the topic.
Priority: High - Best performing category.
2. Leverage LinkedIn Video
Data: LinkedIn Video makes up for 30,000-35,000 impressions per month.
Action: Identify opportunities to produce Video content for LinkedIn.
Priority: Medium - proven high-engagement content format as per platform.
3. Increase publishing frequency for Case studies / Walkthrough content
Data: 80% of the top-performing CTR content falls under this category.
Action: Identify opportunities to publish more of such content.
Priority: Medium - High CTR format.
4. Evaluate content strategy for Event / Career-based content
Data: Both accounts make up for only 5% of the volume combined.
Action: Evaluate pain points in current content strategy
Priority: Medium - Underperforming brands
Conclusion
- Data from November has clarified the trends for Observability content.
- The data validates how efficiency increases when one implements the learnings from content analysis, highlighted by our best-ever content efficiency, a 17% increase over five months (which is massive for a 1.5 million impressions base).
- LinkedIn Video is here, and marketers and creators in the cloud-native space should make the most of this platform-format combination.
Meanwhile, Observability content wears the crown for the most in-demand content, while Resource optimization and Configuration management have maintained consistency at the top.
Strategic Implications: Content creators and marketers should prioritize LinkedIn Video as a platform-format combination if the Videos are produced on trending topics, even better.
Looking Forward: Demand for Observability content provides a good opportunity to scale content on the topic. While exploring Video format on LinkedIn is a good start for marketers, they should be aware of the change in metrics for Twitter.