
Kubernetes Insights Report - June 2025
Published in July 2025
TL;DR: This report examines the June 2025 content performance across the LearnKube network (LearnKube, Kube Architect, Kubesploit, Kube Builders, Kube Events, Kube Careers, and KubeFM), comparing key metrics with May 2025 to identify trends and optimization opportunities.
In June 2025, we published 1,397 content pieces across multiple platforms, generating over 1.7 million social media impressions.
While overall volume decreased by 8.4% from May's 1,525 pieces, the network maintained strong engagement patterns, particularly in emerging categories like platform engineering and practical security content.
Executive Summary
Key Performance Dashboard - June vs May
As we published 8.4% fewer posts in June vis-a-vis May, correspondingly, the total impressions declined by 10.5%. However, the average engagement only decreased by 2.3%.

Top 3 Data-Driven Insights
- Resource optimization content achieves highest per-piece performance - 5,055 avg impressions vs infrastructure's 2,277
- Platform Engineering shows strong CTR improvement - +0.67pp vs May, indicating growing audience interest
- Event announcements show extreme engagement variance - From 37 avg impressions to 23.68% CTR peaks
Volume & Reach Analysis
Platform Distribution and Performance
Let's look at the content performance with respect to popular social media platforms.

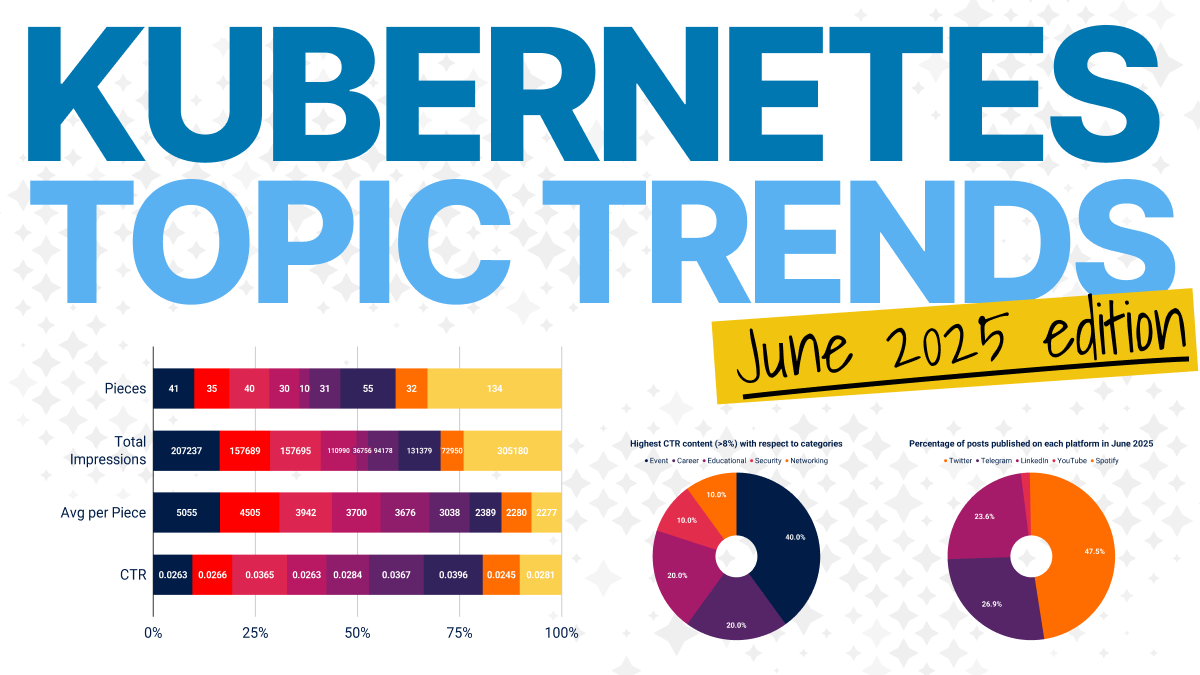
47.6% of all our posts were published on Twitter (given the short-form nature of the platform), while 26.9% were on Telegram, and 23.6% were on LinkedIn.
While our Podcast was responsible for YouTube (1.7%) and Spotify (0.3%) posts.
Cross-Platform Performance Insights
What's interesting is that even when the posts on LinkedIn were half that of Twitter, the total impressions were only 2.2% lower.
And what's even more interesting is how we published 14% more posts on Telegram than LinkedIn, yet the impressions from Telegram are 338% lower than those of LinkedIn.

With the above statistics, LinkedIn has the highest average impressions per post at 2,330, Twitter at 1,181, Telegram at 465, with Youtube (223) and Spotify (199) wrapping up the list.
Platform Evolution - May vs June 2025
Let's take a look at whether the average impressions per post have changed between May and June 2025.

While the metrics for LinkedIn have fallen by 4.2%, they have increased by 5.2% for Twitter.
The decline is consistent for Telegram (by 6.9%) and YouTube (by 8.3%), while it has increased by 31% (lower base to begin with).
Content Category Deep Dive
Content Performance analysis: Which Technical topics get the most attention?
While we published the most pieces on Infrastructure topics (134) and consequently received the most impressions for them (305,180), the details reveal a rather interesting story.
| Category | Pieces | Total Impressions | Avg per Piece | CTR |
|---|---|---|---|---|
| Resource Optimization | 41 | 207,237 | 5,055 | 2.63% |
| Configuration Management | 35 | 157,689 | 4,505 | 2.66% |
| Networking | 40 | 157,695 | 3,942 | 3.65% |
| Development | 30 | 110,990 | 3,700 | 2.63% |
| Data on Kubernetes | 10 | 36,756 | 3,676 | 2.84% |
| Observability | 31 | 94,178 | 3,038 | 3.67% |
| Security | 55 | 131,379 | 2,389 | 3.96% |
| Platform Engineering | 32 | 72,950 | 2,280 | 2.45% |
| Infrastructure | 134 | 305,180 | 2,277 | 2.81% |
The key takeaways from the analysis are:
- Even though we received the most impressions for Infrastructure topics, we got the lowest average impressions per post for them (2277 per post), highlighting low efficiency. The best in this metric were Resource optimization topics, with an average of 5,055 impressions per post. They were followed by Configuration management (4,505), Networking (3,942), Development (3,700), Data on Kubernetes (3,676), and the rest.
- What's even more interesting is that despite lower average impressions per post, we got the best Click-Through Rate (CTR) for Security topics at 3.96%. This was followed by Observability (3.67%), Networking (3.65%), Data on Kubernetes (2.84%), Infrastructure (2.81%), and the rest.
CTR Performance Comparison (June vs May)

The most significant change in CTR performance occurred for development topics, which decreased by 0.91 pp in a month, while infrastructure topics dropped by 0.82% pp in CTR.
The highest gainer in terms of CTR was Platform Engineering topics, which grew by 0.67% pp in June 2025.
Account Performance Analysis
June Account Performance

Note: Account performance appears lower across all accounts.
The LearnKube educational account maintained consistent content output (68 pieces), while Architecture content achieved the highest per-piece efficiency (1,029 average impressions).
Event content shows concerning performance with only 37 average impressions per piece, suggesting event promotion strategies need review.
Top Content Performance Analysis
Highest Volume Content (>15k impressions)

Content piece with the highest impression in June 2025 was the Advanced Kubernetes course (32,283), kubectx:switch between clusters (26,611), KRO: Kubernetes Research Orchestration (22,319), Grafana Dashboards (18,764), and Zeropod: Scale to Zero (18,402)
While these content pieces had the most impressions, the CTR hierarchy differed slightly.
Highest CTR Content (>8%)
| Content | CTR | Clicks | Impressions | Category |
|---|---|---|---|---|
| Kubernetes Community Days Bengaluru | 23.68% | 54 | 228 | Event |
| Solution Architect | 16.47% | 42 | 255 | Career |
| DevOps Engineer | 12.83% | 58 | 452 | Career |
| Kubernetes audit log policy | 10.63% | 355 | 3,339 | Security |
| Warmup Your Pods Using Istio | 10.46% | 463 | 4,426 | Networking |
| Kubernetes Community Days Nigeria | 10.00% | 20 | 200 | Event |
| Kubernetes Community Days New York | 9.59% | 26 | 271 | Event |
| Kubernetes best practices | 9.09% | 381 | 4,191 | Educational |
| Kubernetes Community Days Utrecht | 8.94% | 130 | 1,454 | Event |
| The Kubernetes networking guide | 8.47% | 850 | 10,031 | Educational |
What's also interesting to see is how most of this high CTR content falls under the Event category

Key Trends and Insights
Content Category Evolution Patterns
The June data reveals a maturing content ecosystem with clear performance differentiation.
Resource optimization content continues to dominate reach efficiency, generating over 5,000 impressions per piece — more than double the infrastructure category average.
This suggests that the audience's appetite for cost—and performance-focused content remains strong despite broader economic uncertainties.
Platform engineering emerged as a breakout category with significant CTR improvements (+0.67pp), indicating the community's growing focus on developer experience and internal tooling.
This shift aligns with industry trends toward platform teams and developer productivity optimization.
The Security Content Renaissance
Security content performance tells a compelling story of audience maturation.
While the category maintained a solid 3.96% average CTR, practical implementation content like the Kubernetes audit log policy achieved exceptional 10.63% engagement rates.
This dramatic performance gap suggests the community has moved beyond security awareness toward hands-on implementation guidance.
Infrastructure Content Saturation Signals
The infrastructure category's performance presents a cautionary tale of content market dynamics.
Despite producing 134 pieces—nearly double any other category—individual pieces averaged only 2,277 impressions.
This volume-versus-efficiency tension suggests market saturation or content cannibalization, requiring strategic reevaluation.
Event Content Breakthrough Discovery
June revealed event content as an unexpected engagement champion.
Community Days content consistently achieved premium CTR rates (8-23%), dramatically outperforming traditional technical content.
This pattern suggests a strong pent-up demand for community connection and in-person experiences, particularly as the industry emerges from distributed work patterns.
Strategic Recommendations
1. Expand Resource Optimization Content
Data: Highest efficiency (5,055 avg impressions) but declining CTR (-0.65pp)
Action: Analyze high-performing pieces to identify engagement drivers.
Priority: High-protect best-performing category
2. Scale Security Practical Content
Data: Security audit policy achieved 10.63% CTR vs category average 3.96%
Action: Focus on practical, hands-on security implementation guides.
Priority: High - proven high-engagement format
3. Investigate Infrastructure Content Performance
Data: Highest volume (134 pieces) but lowest efficiency (2,277 avg impressions)
Action: Analyze if volume is cannibalizing individual piece performance
Priority: Medium - large volume impact
4. Develop Event Content Framework
Data: Event content ranges from 37 to 23.68% CTR - extreme variance
Action: Identify characteristics of high-CTR event content for replication
Priority: Medium - emerging category with high potential
5. Leverage Platform Engineering Momentum
Data: +0.67pp CTR improvement, showing growing audience interest
Action: Increase content volume in this category while momentum builds
Priority: Medium - capitalize on positive trend
Conclusion
- June 2025 marks a strategic inflexion point for the LearnKube network's content performance.
- The month's results validate a more curated approach to content creation, with 8.4% fewer pieces generating proportionally strong engagement across key categories.
- The emergence of platform engineering as a high-growth category (+0.67pp CTR improvement) signals the community's evolution toward sophisticated internal tooling discussions.
= Meanwhile, security content's bifurcation between general awareness (3.96% CTR) and practical implementation (10.63% CTR) suggests audiences increasingly demand actionable, hands-on guidance over theoretical content.
Strategic Implications: Content creators and marketers should capitalize on emerging high-performance categories while addressing infrastructure content's efficiency challenges.
Event content's breakthrough performance (8-23% CTR) presents an untapped opportunity for systematic community engagement scaling.
Looking Forward: Platform performance stability across LinkedIn (2,330 average impressions) and Twitter (1,181 average impressions) provides a solid foundation for scaling successful content formats while optimizing underperforming categories.