
Kubernetes Insights Report - July 2026
Published in August 2026
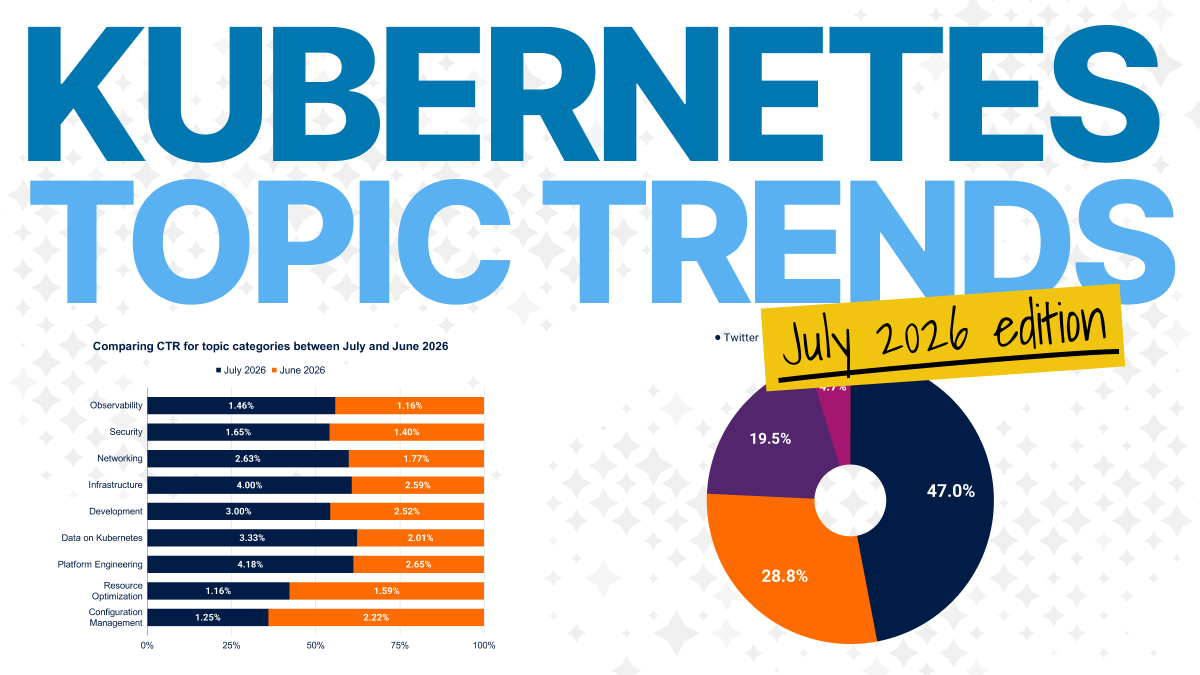
TL;DR: Every month, the LearnKube network (LearnKube, Kube Architect, Kubesploit, Kube Builders, Kube Events, Kube Careers, KubeFM, and Kube Today) curates and shares Kubernetes news, tutorials, and tools across social media. This report examines what readers engaged with most in July 2026: which topics drew interest, which content formats drove clicks, and what the data says about where the Kubernetes community's attention is heading.
In July 2026, 1,600 pieces of Kubernetes content reached readers across multiple platforms, totaling 1,033,319 views.
We published 11% more content in July 2026 than in June, yet impressions grew by 28.5% and content efficiency improved by 16%. The biggest shift was on LinkedIn: after two months of weak performance, the platform recovered strongly and helped restore architecture content as one of the network's top performers.
Executive Summary
Readership Dashboard: July vs June 2026
Readers viewed our content 1,033,319 times in July 2026, 28.5% more than in June 2026.
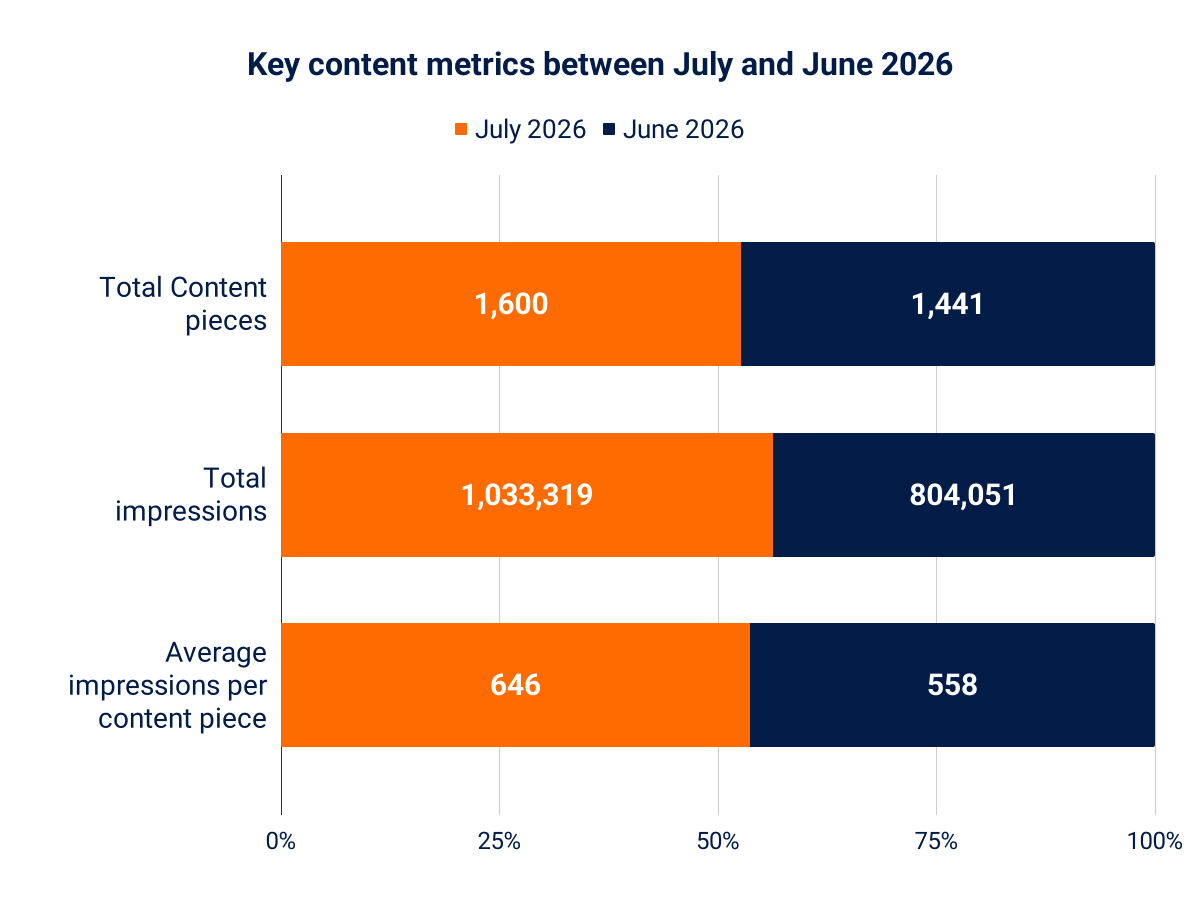
Overall impressions were up by 28.5% month-on-month, and content efficiency improved by 16%. Clicks grew by 26.7%, while the average CTR improved from 1.98% to 2.51%.
Top 3 Readership Insights
- LinkedIn recovered sharply: LinkedIn impressions rose 74.1% month-on-month, and impressions per post improved by 48.5%.
- Architecture content returned to form: Kube Architect impressions rose 124.2%, bringing it within 1.3% of LearnKube, the top brand by readership.
- Case studies drove the best content efficiency: Case studies averaged 5,987 impressions per piece and delivered the best CTR among tracked content types at 2.12%.
Where Readers Found Content
Let's look at where readers discovered content across platforms.
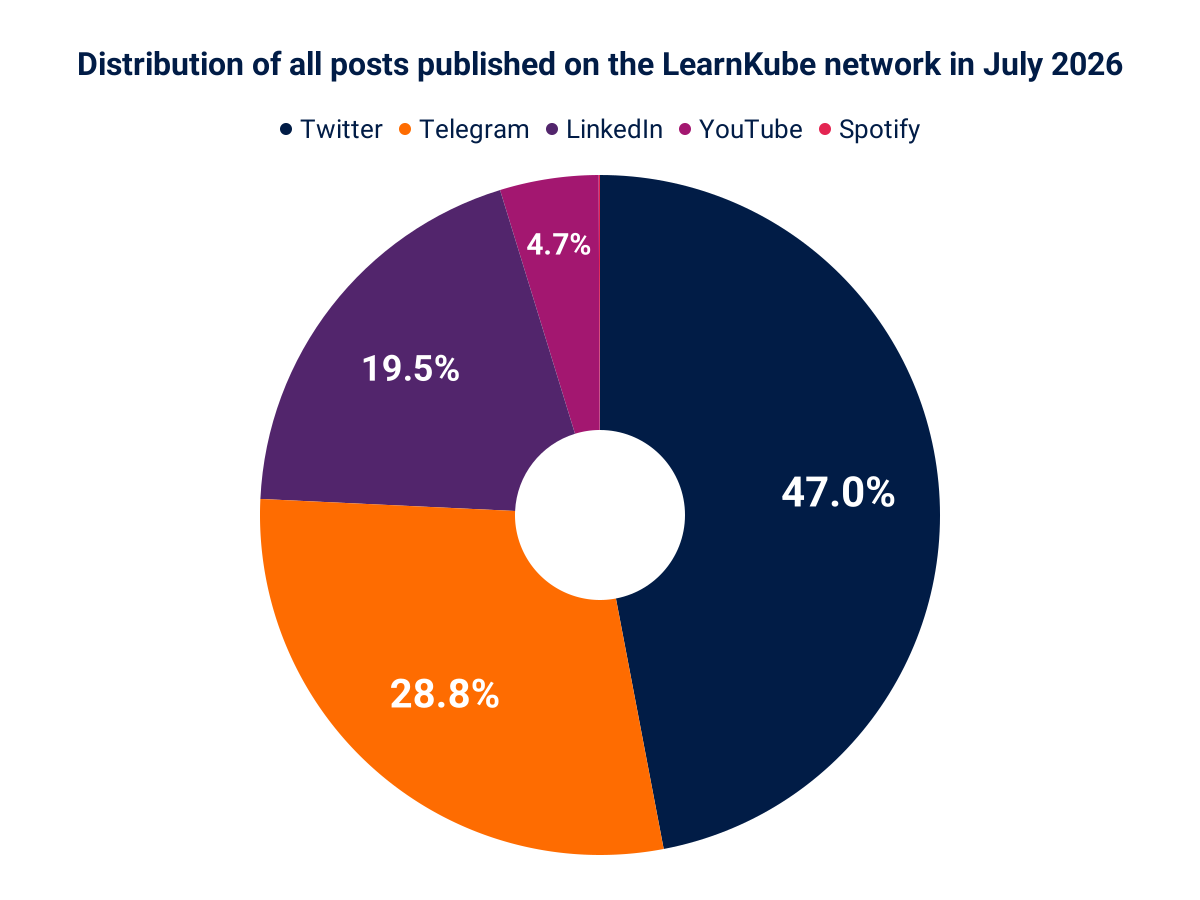
Readers encountered 47.0% of content on Twitter, 28.8% on Telegram, 19.5% on LinkedIn, and 4.7% on YouTube.
How did reader engagement vary across these platforms?
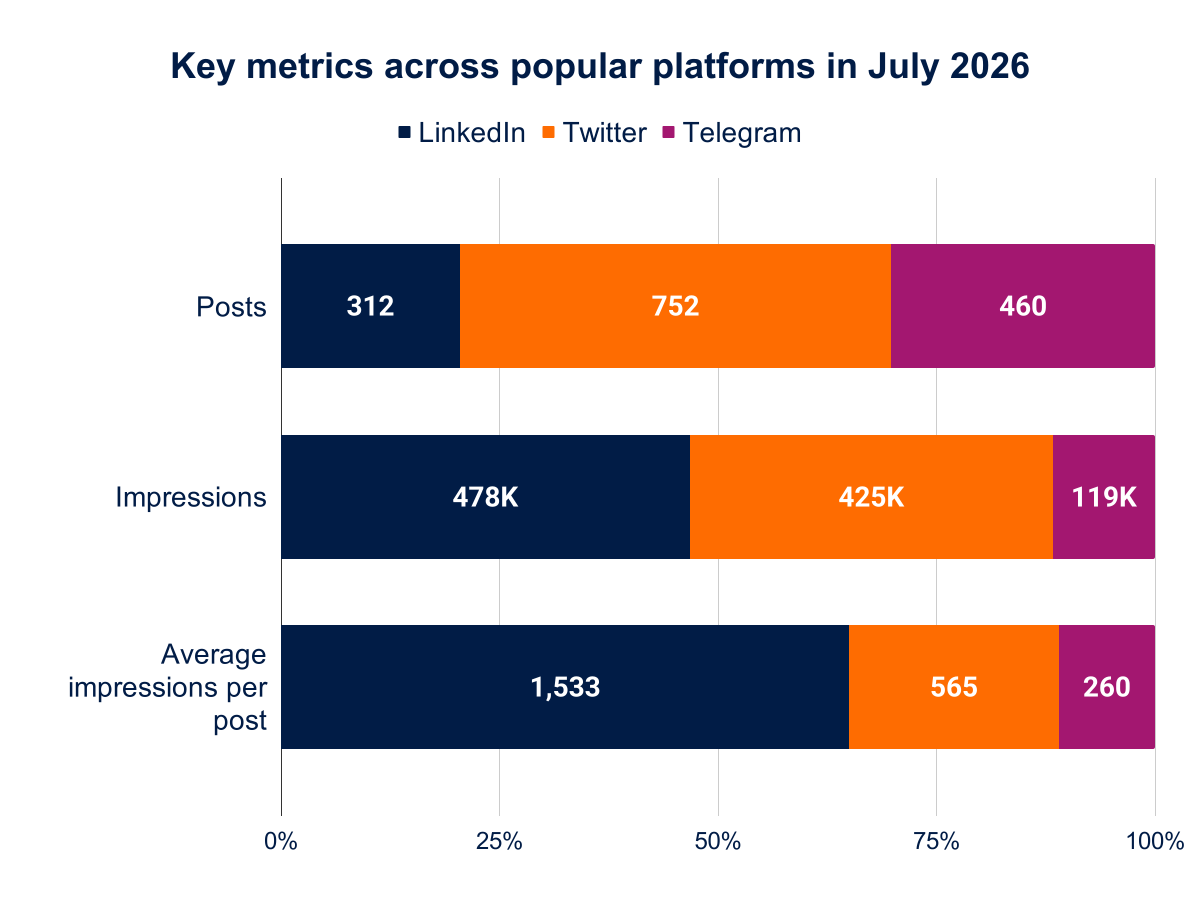
Platform performance changed markedly in July. While Twitter remained the largest publishing channel by volume, LinkedIn regained the top spot for total viewership.
| Platform | Posts | Post share | Impressions | MoM impressions | Avg impressions/post | MoM efficiency |
|---|---|---|---|---|---|---|
| 312 | 19.5% | 478,445 | +74.1% | 1,533 | +48.5% | |
| 752 | 47.0% | 425,078 | +2.3% | 565 | -4.9% | |
| Telegram | 460 | 28.8% | 119,448 | +13.9% | 260 | +3.5% |
| YouTube | 75 | 4.7% | 10,268 | +16.6% | 136 | -30.2% |
LinkedIn recovered from June's low
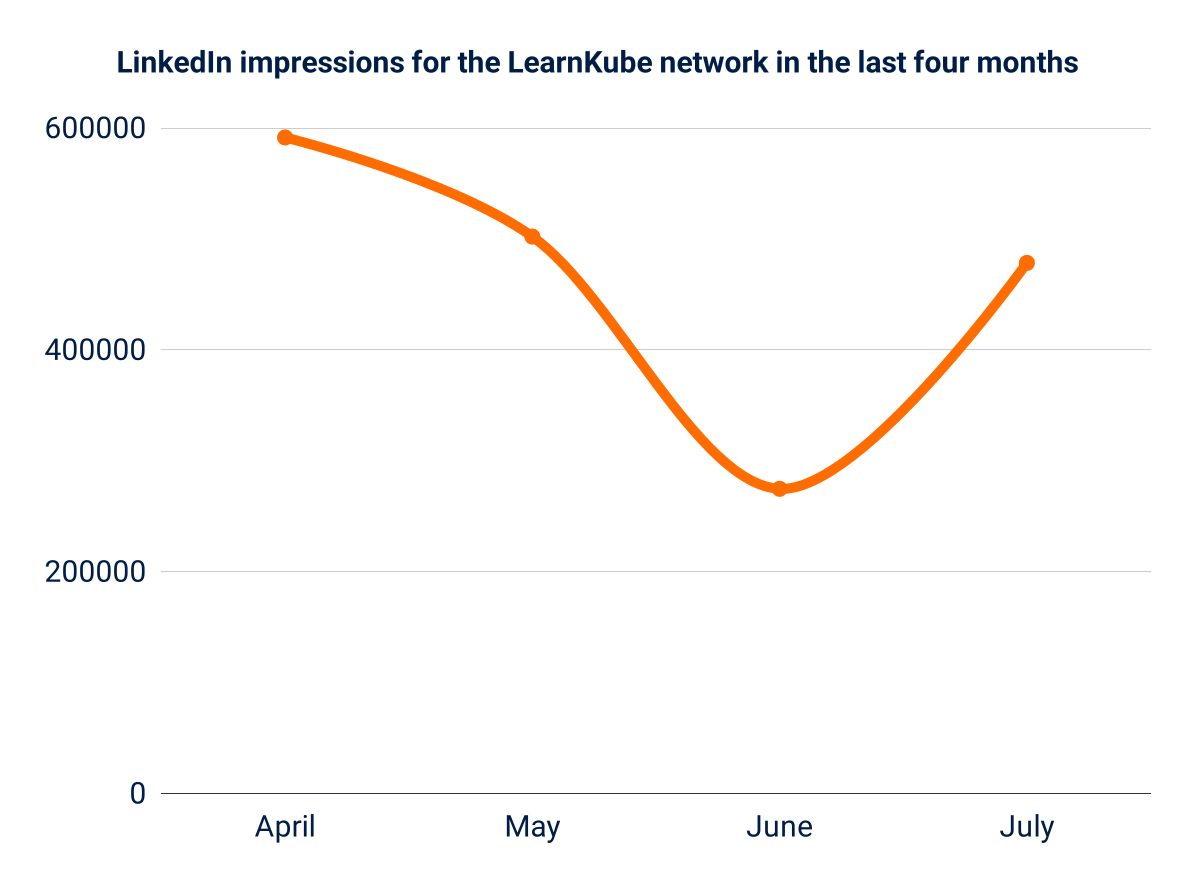
LinkedIn's subpar viewership was the main reason network performance suffered in June. July reversed that pattern.
LinkedIn impressions rose from 274,745 to 478,445, an increase of 74%. At the same time, content efficiency improved from 1,033 to 1,533 impressions per post (+48%).
The recovery shows that our publishing strategy changes worked.
What did we change, and what can marketers and content creators learn from it?
- On LinkedIn, we prioritized specificity and stopped reposting content from brands in unrelated categories. For example, architecture-focused content no longer receives likes or reposts from Kube Careers, our Kubernetes job board. Publishing and distributing category-consistent content helped improve performance.
- Twitter and Telegram remain stable distribution channels, but LinkedIn is where large swings in total network reach can now happen.
What Topics Readers Cared About
July brought another shift in reader interest across topic categories.
| Category | Content pieces | Total impressions | Average impressions/piece | CTR |
|---|---|---|---|---|
| Observability | 43 | 42,557 | 990 | 1.47% |
| Security | 45 | 43,878 | 975 | 1.66% |
| Networking | 19 | 17,315 | 911 | 2.63% |
| Infrastructure | 50 | 24,777 | 496 | 4.00% |
| Development | 13 | 5,132 | 395 | 3.00% |
| Data on Kubernetes | 3 | 1,168 | 389 | 3.34% |
| Platform Engineering | 14 | 4,846 | 346 | 4.19% |
| Resource Optimization† | 3 | 7,621 | 2,540 | 1.17% |
| Configuration Management† | 2 | 2,080 | 1,040 | 1.25% |
| Edge & IoT† | 1 | 76 | 76 | 0.00% |
† We excluded these topics from the conclusions because too few pieces were published to draw meaningful conclusions.
What this says about readers:
- Security and Observability were the most in-demand topic categories for July. Observability topped the efficiency list, while Security ranked highest in volume with 43,878 impressions.
- Networking was the most popular topic category in June. Although impressions fell by more than 30% in July, CTR improved by 0.86 percentage points. Networking may not have been the most in-demand category in July, but readers clicked when a piece was relevant.
- Infrastructure and Platform Engineering had the strongest CTRs, at 4.00% and 4.19%, respectively. While these weren't volume leaders, they attracted high-intent readers.
How Reader Engagement Shifted (July vs June 2026)
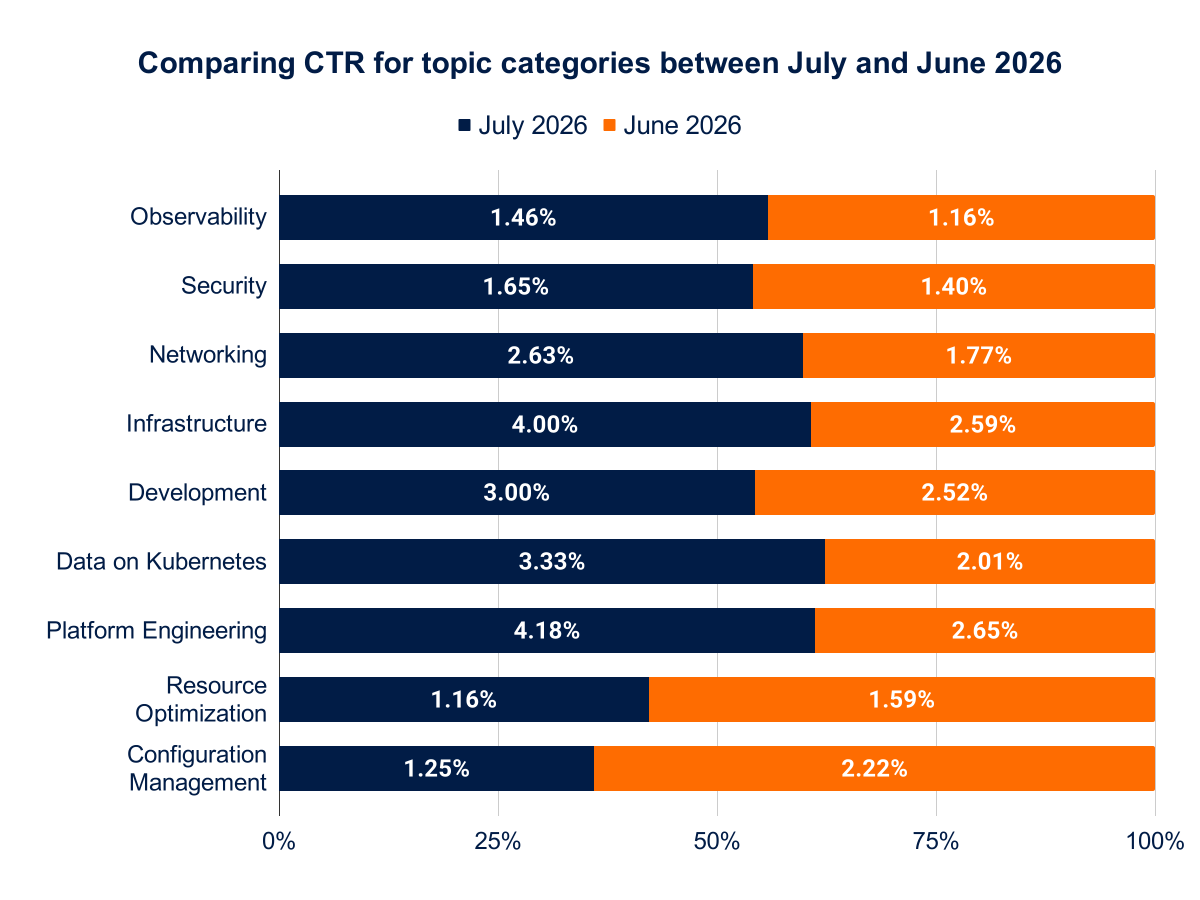
How did click-through behavior change between the two months? Because of low volume, we excluded Edge & IoT, Resource Optimization, and Configuration Management from the conclusions below.
- The biggest CTR gains were in Platform Engineering (+1.54 pp), Infrastructure (+1.42 pp), and Data on Kubernetes (+1.33 pp).
- All the major topic categories improved their CTRs, meaning readers clicked more often in July. This suggests that June's issue was limited discovery, especially on LinkedIn, rather than content quality.
- The average CTR improved by 0.53 percentage points, from 1.98% in June to 2.51% in July.
Readership by Brand
Brand performance shifted again in July:
| Brand | Posts | Impressions | MoM impressions | Avg impressions/post | MoM efficiency |
|---|---|---|---|---|---|
| LearnKube | 158 | 313,245 | +18.0% | 1,983 | +1.6% |
| Kube Architect | 125 | 309,227 | +124.2% | 2,474 | +38.1% |
| Kubesploit | 107 | 127,251 | +21.7% | 1,189 | -7.9% |
| K3s | 148 | 108,868 | +16.7% | 736 | -9.3% |
| KubeFM | 313 | 71,615 | -3.5% | 229 | -23.5% |
| Kube Careers | 439 | 68,071 | -26.4% | 155 | -20.7% |
| Kube Events | 235 | 24,774 | -9.3% | 105 | -2.3% |
LearnKube remained the top brand by impressions, but Kube Architect was only 4,018 impressions behind. The more important story is efficiency: Kube Architect averaged 2,474 impressions per post, the highest among the network's brands.
Architecture content recovered with LinkedIn
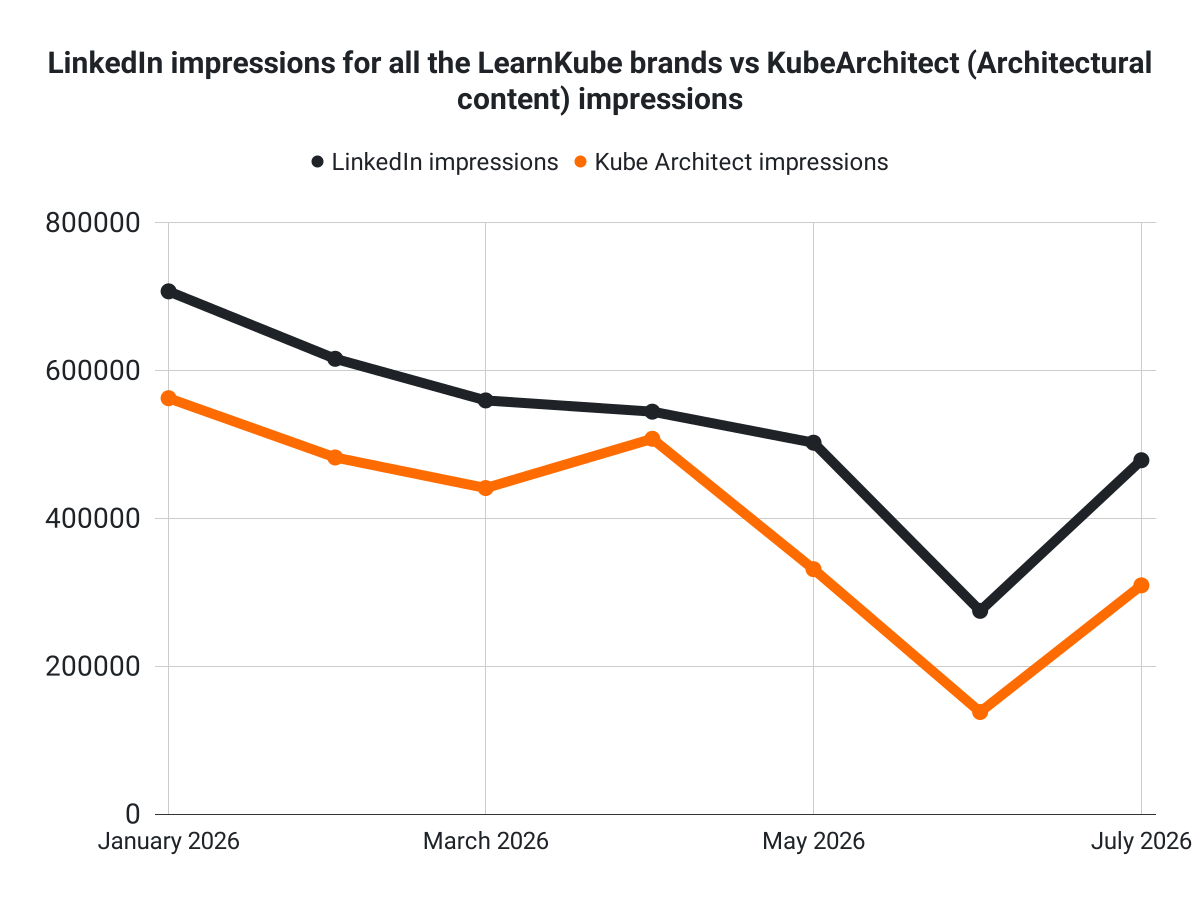
The July rebound confirms the June hypothesis: architecture content was hurt by LinkedIn distribution, not by a collapse in reader interest.
Kube Architect impressions rose by 124.2% month-on-month. Its LinkedIn impressions bounced back from 62,260 in June to 224,454 in July. The brand accounted for nearly half of all LinkedIn impressions in July.
If you are a content creator or marketer, July reinforces the same lesson from June: changes in LinkedIn distribution can quickly reshape brand-level performance.
What Readers Clicked On Most
| Content | Total impressions | CTR | Clicks |
|---|---|---|---|
| KEDA GPU Scaler | 19,363 | 0.91% | 177 |
| Catching Helm Drift Before It Catches You | 18,143 | 1.35% | 245 |
| How an Admin Cluster Keeps Application Clusters in Sync with GitOps | 17,875 | 1.21% | 216 |
| Invisible OOMkill: Java pods crashing in Kubernetes | 15,420 | 2.28% | 351 |
| Using Kubernetes ConfigMaps as a Real-Time State Store | 14,865 | 1.08% | 161 |
| GOMAXPROCS Is Lying to Your Kubernetes Pod (Costing You CPU) | 14,126 | 0.53% | 75 |
| ingress-nginx Is Archived: How We Migrated to kgateway (and Didn't Break Prod) | 13,821 | 1.14% | 157 |
| Radar: Kubernetes visibility | 13,577 | 1.38% | 187 |
| Kube-Argus | 12,947 | 1.75% | 227 |
| Kondense: automated resource sizing | 12,719 | 0.86% | 109 |
- Tool overviews remained strong, but July's highest-volume list was more balanced than June's. Code projects, architecture articles, tutorials, and case studies all appeared near the top.
- The most-viewed piece was KEDA GPU Scaler, with 19,363 views. It was followed by Catching Helm Drift Before It Catches You, with 18,143 views, and How an Admin Cluster Keeps Application Clusters in Sync with GitOps, with 17,875 views.
- Architecture content led July's highest-volume list.
Most-Clicked Content (>2% CTR and above 4,000 impressions)
| Content | CTR | Total impressions | Clicks |
|---|---|---|---|
| We're a 3-person tech team running production Kubernetes - So we built an AI SRE | 4.11% | 8,889 | 365 |
| Our Kubernetes operator didn't scale, so we rebuilt it | 3.48% | 5,515 | 192 |
| Evicting MCP tool calls from your Kubernetes cluster | 3.25% | 5,196 | 169 |
| Which of our Containers are Chainguard? | 2.43% | 7,848 | 191 |
| KubePlumber: Kubernetes network validation utility | 2.28% | 4,206 | 96 |
| Invisible OOMkill: Java pods crashing in Kubernetes | 2.28% | 15,420 | 351 |
| K8s Diagram Generator | 2.26% | 7,242 | 164 |
| Awesome Kubernetes Architecture Diagrams | 2.06% | 4,795 | 99 |
Here's what the highest-CTR content says about readers:
- Story-led case studies performed best. The top two pieces both describe a clear operational problem and a concrete resolution, presented through an interesting story arc.
- AI-themed content was a strong hook for readers. The highest-CTR article combined production Kubernetes, a small-team constraint, and AI SRE tooling.
- Security-focused titles converted well, too. Chainguard, MCP isolation, and OOMKill debugging all suggest operational risk, which readers were willing to click through to understand.
What happens when we categorize the most-clicked content by topic?
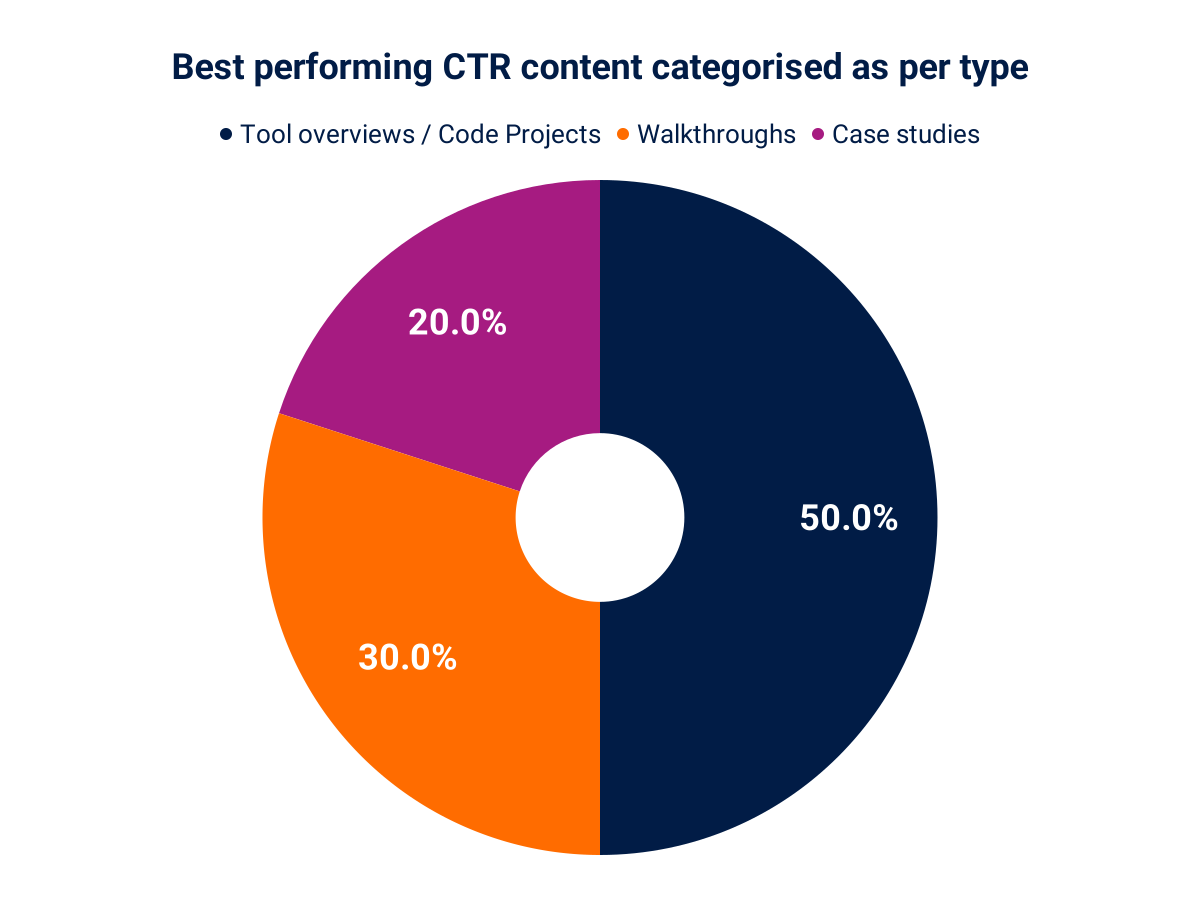
Here are the key takeaways:
- Case studies accounted for the two highest-CTR pieces, while tool overviews made up half of the best-performing entries.
- The two highest-CTR pieces were We're a 3-person tech team running production Kubernetes - So we built an AI SRE and Our Kubernetes operator didn't scale, so we rebuilt it. Both are case studies with titles that create curiosity and attract clicks. Intriguing titles help earn more clicks.
Content Format Performance
| Content type | Pieces | Impressions | Avg impressions/piece | Clicks | CTR |
|---|---|---|---|---|---|
| Case Study | 14 | 83,819 | 5,987 | 1,781 | 2.12% |
| Tool overviews / Code projects | 68 | 327,908 | 4,822 | 5,005 | 1.53% |
| Article | 32 | 150,628 | 4,707 | 2,840 | 1.89% |
| Tutorial | 37 | 116,913 | 3,160 | 1,480 | 1.27% |
- Tooling is an audience favorite, so we increased the frequency of tool overviews and code projects. They generated 327,908 impressions and 5,005 clicks, but the cloud-native audience was more likely to notice and click on case studies, especially narrative, story-led pieces.
Key Trends
LinkedIn recovered, but more upside is still possible
LinkedIn generated 478,445 impressions in July, up by 74.1% from June. However, the platform's 2026 monthly average, excluding June, was around 600,000 impressions, leaving reasonable room for further growth.
The platform numbers are volatile, but July's performance suggests that the publishing strategy now aligns with LinkedIn's new variables. August's data will show whether the recovery continues.
Architecture content is back in demand
Kube Architect impressions grew by 124.2%, and the brand delivered the highest impressions per post across the network.
Architecture content never went out of demand; our distribution in June was the problem. With our LinkedIn strategy adjusted, the data showed that architecture content remains a favorite among the Kubernetes audience.
Case studies deserve more publishing volume
Case studies generated the highest average impressions per piece and the best CTR among all content formats.
Readers were drawn to story-led explanations of mishaps, lessons, and walkthroughs from experienced practitioners.
Observability and Security remain dependable high-volume categories
Observability and Security were the only topic categories to exceed 40,000 impressions in July.
Neither category topped efficiency, but both remain reliable high-volume categories for the Kubernetes audience.
What This Means
1. Keep leveraging content on LinkedIn, but stay specific
Signal: LinkedIn impressions grew 74.1%, and Kube Architect recovered strongly.
Implication: The network should continue optimizing for semantic relevance and center distribution on a category-consistent strategy.
2. Increase Security and Observability content frequency
Signal: Observability was the most content-efficient high-volume topic category (990 impressions per post), while Security had the highest volume (43,878 impressions).
Implication: Demand for Observability content has held for three consecutive months. Security content is regularly among the most-clicked topic categories and received the highest volume in July. Increasing the frequency of both topics will help test whether Observability demand remains consistent and whether interest in Security content is growing.
3. Publish more case studies in August
Signal: Case studies averaged 5,987 impressions per piece and delivered a 2.12% CTR.
Implication: Readers want to know how a team handled mishaps and learned from them, and what they could implement in their day-to-day operations.
4. Test Resource Optimization with more volume
Signal: Resource Optimization averaged 2,540 impressions per piece, the highest topic efficiency in July, but we couldn't draw conclusions because the volume was low (only three pieces).
Implication: Since the sample size in July was small, the network must include more content from this category in August to test whether these topics can scale without losing efficiency.
5. Treat Networking as a high-intent category, not only a volume category
Signal: Networking impressions fell 37.5%, but CTR improved by 0.86 percentage points.
Implication: The high CTR indicates the audience is clicking on these topics; if selected with intent, the metrics for this topic category may reach previous months' heights.
Conclusion
July 2026 showed that the LearnKube network can recover from platform-driven declines when the publishing strategy aligns with reader intent.
- LinkedIn bounced back from a 12-month low and regained its place as the best-performing platform for the network.
- Kube Architect recovered sharply, confirming that architecture content remains highly relevant to the audience.
- Case studies delivered the best combination of reach and clicks, especially when paired with intriguing titles.
- Security and Observability remained the strongest high-volume categories.
Readers still want practical Kubernetes content, but July clarified which packaging works best: focused architecture pieces, production case studies with story arcs, and operationally specific but intriguing titles. August should build on the LinkedIn recovery while testing whether Resource Optimization and case-study content can scale.