
Kubernetes Insights Report - July 2025
Published in August 2025
TL;DR: This report examines the July 2025 content performance across the LearnKube network (LearnKube, Kube Architect, Kubesploit, Kube Builders, Kube Events, Kube Careers, and KubeFM), comparing key metrics with June 2025 to identify trends and optimization opportunities.
In July 2025, we published 1,406 content pieces across multiple platforms, generating almost 1.7 million social media impressions.
While overall volume increased marginally by 0.6% from June's 1,397 pieces, the network maintained strong engagement patterns, particularly in emerging categories like platform engineering and practical security content.
Executive Summary
Key Performance Dashboard - July vs June
We published almost a similar number of posts (only 0.6% more) in July vis-a-vis June; however, the total impressions declined slightly by 5.60% while the average engagement only decreased by 6.32%.

Top 3 Data-Driven Insights
- Configuration Management content achieves highest per-piece performance - 5,205 avg impressions vs infrastructure's 1,934
- Platform Engineering shows strong CTR improvement - +1.08pp vs June, indicating growing audience interest
- Event announcements show extreme engagement variance - From 43 avg impressions to 25.58% CTR peaks
Volume & Reach Analysis
Platform Distribution and Performance
Let's look at the content performance with respect to popular social media platforms.

49.4% of all our posts were published on Twitter (given the short-form nature of the platform), while 25.9% were on Telegram, and 22.7% were on LinkedIn.
Since we didn't release a new podcast episode in July, there were no posts on Spotify, but our repurposed videos (from previous podcast episodes) published on YouTube made up for 2.1% of the total posts.
Cross-Platform Performance Insights
What's interesting is that even when the posts on LinkedIn were less than half that of Twitter, the total impressions were 12% higher.
And what's even more surprising is how we published 14% more posts on Telegram than LinkedIn, yet the impressions from Telegram are 361% lower than those of LinkedIn.

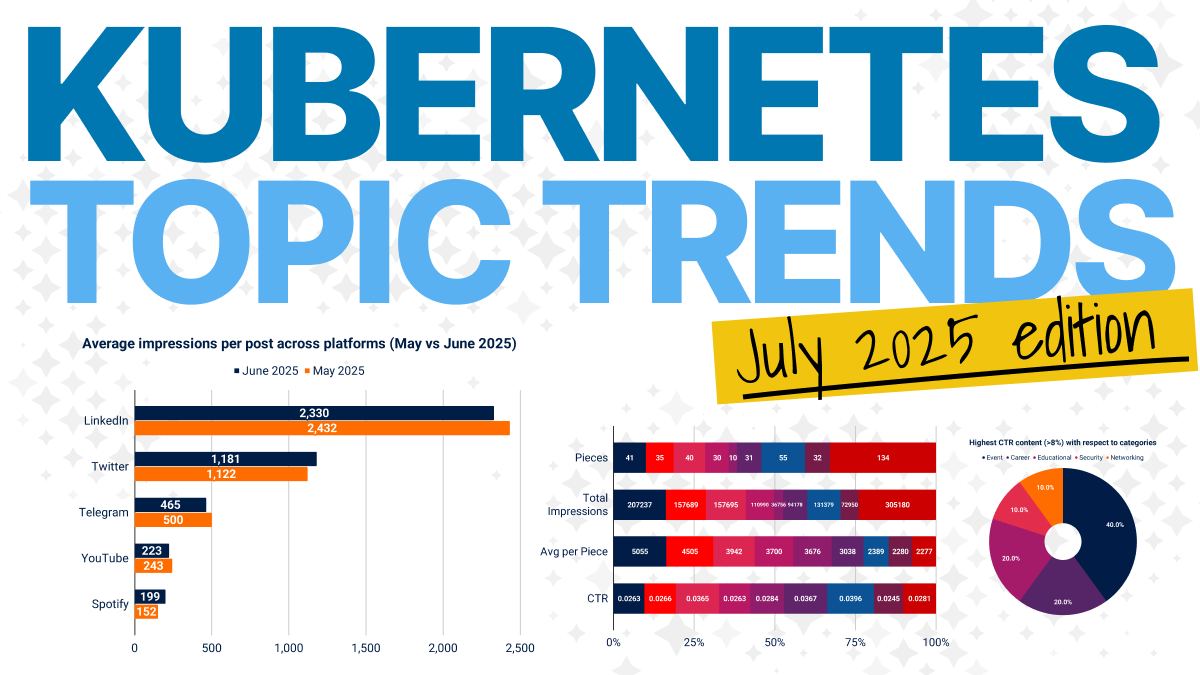
With the above statistics, LinkedIn has the highest average impressions per post at 2,429_**, Twitter at 993_, Telegram at 461_, and _Youtube (272)* wrap up the list.
Platform Evolution - June vs July 2025
Let's look at whether the average impressions per post have changed between June and July 2025.

While LinkedIn's metrics have risen by 4.23%, Twitter's have decreased by almost 16%.
While the average has almost been consistent for Telegram, it has risen by 21% for YouTube, and has fallen by 100% for Spotify (both platforms have lower base numbers to begin with)
Content Category Deep Dive
Content Performance analysis: Which Technical topics get the most attention?
While we published the most pieces on Infrastructure topics (114) and consequently received the most impressions for them (220,469), the details reveal a rather interesting story.
| Category | Pieces | Total impressions | Average impressions per piece | CTR |
|---|---|---|---|---|
| Configuration Management | 32 | 166,553 | 5,205 | 3.40% |
| Resource Optimization | 32 | 118,818 | 3,713 | 3.23% |
| Data on Kubernetes | 7 | 25,892 | 3,699 | 2.83% |
| Platform Engineering | 44 | 140,568 | 3,195 | 3.53% |
| Observability | 31 | 93,681 | 3,022 | 3.13% |
| Networking | 40 | 106,107 | 2,653 | 3.84% |
| Security | 47 | 102,722 | 2,186 | 4.10% |
| Infrastructure | 114 | 220,469 | 1,934 | 3.27% |
| Development | 28 | 42,408 | 1,515 | 2.94% |
The key takeaways from the analysis are: Even though we received the most impressions for Infrastructure topics, we got one of the fewest average impressions per post for them (1,934 per post), highlighting low efficiency. The best in this metric were Configuration Management topics, with an average of 5,205 impressions per post. They were followed by Resource optimization (3,713), Data on Kubernetes (3,699), Platform Engineering (3,195), and Observation (3,022). What's even more interesting is that despite lower average impressions per post, we got the best Click-Through Rate (CTR) for Security topics at 4.10%. This was followed by Networking (3.84%), Platform Engineering (3.53%), Configuration management (3.40%), Infrastructure (3.27%), and the rest.
CTR Performance Comparison (July vs June)

The highest change in CTR performance has occurred for Platform Engineering topics, which increased by 1.08 pp in a month, while Observability topics dropped by 0.54 pp CTR.
What's also interesting is to see how the CTR has increased month-on-month for most topics by 0.15-1.08 pp.
Account Performance Analysis
July Account Performance

Note: Account performance appears good across all accounts.
It's interesting to see how our job and event boards, Kube Careers and Kube Events, have the most number of published posts (due to the sheer nature of the content), yet our Kube Architect account had the highest impressions, with more than half a million impressions in total.
The highest efficiency is shown by Kube Architect (3,665 impressions per post) and LearnKube (2,269 impressions per post) content. In contrast, Event and Job board content need review and strategizing since these accounts are the least inefficient.
Top Content Performance Analysis
Highest Volume Content (>15k impressions)

Content piece with the highest impression in July 2025 was the Generate Kube Diagrams tool (32,913), Longhorn: cloud native distributed block storage (19,461), Goodbye, manual RBAC management in Argo CD (17,514), G-Stop Treating YAML Like a String (16,362), and Our Journey to GitOps: Migrating to ArgoCD with Zero Downtime (15,174).
While these content pieces had the most impressions, the CTR hierarchy differed slightly.
Highest CTR Content (>8%)
| Content | CTR | Clicks | Impressions | Category |
|---|---|---|---|---|
| Lessons learned from managing GPU deployments on Kubernetes | 25.58% | 11 | 43 | Event |
| Kubernetes Community Days Utrecht 2025 | 20.30% | 67 | 330 | Event |
| CTA community interviews | 18.09% | 53 | 293 | Event Sponsored |
| How to Build a Multi-Tenancy Internal Developer Platform | 17.47% | 294 | 1683 | Educational - Tutorial |
| Kubernetes on bare-metal: lessons learned | 16.77% | 26 | 155 | Educational - Podcast |
| Advanced Kubernetes course (Singapore) | 15.85% | 39 | 246 | Course - Promotion |
| How Using Availability Zones Can Eat Up Your Budget | 15.25% | 351 | 2302 | Educational - Article |
| Open Source Festival 2025 | 14.81% | 16 | 108 | Events |
| Should We All Use Kubernetes: Hype or Real Need? | 12.50% | 17 | 136 | Events |
| Enhancing Helm Values Management: A Scalable Approach with Root Values | 12.29% | 179 | 1458 | Educational - Article |
What's also interesting to see is how most of these high CTR content falls under the Event category.

Key Trends and Insights
Content Category Evolution Patterns
The July data reveals a maturing content ecosystem with clear performance differentiation.
Configuration management content has risen to dominate the efficiency metrics (it was Resource optimization content at the top last month), generating 5,200 impressions per piece — more than double the infrastructure category average, and more than thrice the content metric for the development category.
This suggests that the audience's appetite for cost—and performance-focused content remains strong despite broader economic uncertainties.
Platform engineering continues to emerge as a breakout category, with significant CTR improvements (+1.08pp) indicating the community's growing focus on developer experience and internal tooling.
This shift aligns with industry trends toward platform teams and developer productivity optimization.
The Security Content Renaissance
Security content performance has been rising since June and continues to grow in July, a trend that tells a compelling story of audience maturation.
While the category has the best average CTR at 4.10%, practical implementation content like the Kubernetes Network Policy Recipes and Securing Kubernetes using honeypots article shows exceptional 10-10.50% engagement rates.
This dramatic performance gap suggests the community has moved beyond security awareness toward hands-on implementation guidance.
Signals for decline in Infrastructure Content popularity
The infrastructure category's performance presents a cautionary tale of content market dynamics.
Despite producing 114 pieces — more than double any other category — individual pieces averaged only 1,934 impressions, a 15% decline month over month.
This volume-versus-efficiency tension suggests market saturation or content cannibalization, requiring strategic reevaluation.
Event Content Breakthrough Continuation
July further solidifies event content as an engagement champion.
The top-performing event content included workshops and conferences, which had exceptional CTR rates (12.50-25.58%) and dramatically outperformed traditional technical content.
This pattern suggests strong pent-up demand for community connection and in-person experiences, particularly as the industry emerges from distributed work patterns.
Strategic Recommendations
1. Configuration Management: From Champion to Strategy Leader
Data: Configuration Management overtook Resource Optimization as the efficiency leader (5,205 vs 3,713 avg impressions)
Action: Deep-dive into top performers like "Generate Kube Diagrams" (32,913 impressions) to extract repeatable success patterns. Create a content series around visual configuration tools and diagram generation.
Priority: High - Build a playbook from this month's winner
2. Double Down on Tool-Based Content
Data: July's top performer was a tool (Generate Kube Diagrams), compared to June's course promotion
Action: Shift content focus toward practical tools, utilities, and hands-on resources. Consider creating a weekly "Tool Tuesday" series showcasing configuration and visualization tools.
Priority: High - Clear audience preference shift detected
3. Platform Engineering: Strike While Hot
Data: Strongest CTR growth (+1.08pp) combined with solid base performance (3,195 avg impressions)
Action: Immediately scale content production by 50% in this category. Focus on internal developer platform case studies and migration stories like "Our Journey to GitOps" (15,174 impressions).
Priority: Critical - Capture momentum before market saturates
4. Security Content Bifurcation Strategy
Data: Security shows highest CTR (4.10%) but moderate impressions (2,186 avg) - opposite of Configuration Management
Action: Create two distinct content tracks: high-volume awareness content and premium deep-dive security implementations. Test bundling security content with configuration management topics.
Priority: High - Untapped potential in combining high-CTR with high-impression strategies
5. Infrastructure Content: Quality Over Quantity Reset
Data: 15% decline in efficiency (2,277 to 1,934 avg impressions) despite maintaining high volume
Action: Implement immediate 30% volume reduction in Infrastructure category. Reallocate resources to Platform Engineering and Configuration Management. Focus remaining infrastructure content on emerging topics only.
Priority: Urgent - Stop the bleeding before brand dilution occurs
6. Event Content Segmentation
Data: Extreme variance from 43 impressions (GPU deployments workshop) to 25.58% CTR
Action: Separate event content into two tiers: "Community Events" (high CTR, low reach) for engagement metrics and "Technical Workshops" for reach metrics. Tailor promotion strategies accordingly.
Priority: Medium - Optimize based on content type rather than treating all events equally
7. LinkedIn Platform Optimization
Data: LinkedIn efficiency increased 4.23% while Twitter dropped 16% - widening platform performance gap
Action: Migrate 15% of Twitter content budget to LinkedIn. Test longer-form, professional content formats on LinkedIn while maintaining Twitter for quick updates and news.
Priority: High - Platform dynamics are shifting rapidly
Conclusion
- July 2025 marks a strategic inflexion point for the LearnKube network's content performance.
- The month's results validate a more curated approach to content creation. Almost the same number of pieces were published as in June 2025, generating proportionally strong engagement across key categories.
- Platform Engineering continues to be a high-growth category (+1.08pp CTR improvement), signalling the community's evolution toward sophisticated internal tooling discussions.
= Meanwhile, security content's bifurcation between general awareness (4.10% CTR) and practical implementation (10.58% CTR) suggests audiences increasingly demand actionable, hands-on guidance over theoretical content.
Strategic Implications: Content creators and marketers should capitalize on emerging high-performance categories while addressing infrastructure content's efficiency challenges.
Event content's breakthrough performance (8-25.58% CTR) presents an untapped opportunity for scaling systematic community engagement.
Looking Forward: Platform performance stability across LinkedIn (2,429 avg impressions) and Twitter (993 avg impressions) provides a solid foundation for scaling successful content formats while optimizing underperforming categories.