
Kubernetes Insights Report - January 2026
Published in February 2026
TL;DR: Every month, the LearnKube network (LearnKube, Kube Architect, Kubesploit, Kube Builders, Kube Events, Kube Careers, KubeFM, and Kube Today) curates and shares Kubernetes news, tutorials, and tools across social media. This report looks at what readers engaged with most in January 2026 — which topics sparked interest, which content formats drove clicks, and what the data tells us about where the Kubernetes community's attention is heading.
In January 2026, 1,370 pieces of Kubernetes content reached readers across multiple platforms, generating over 1.35 million impressions.
After December 2025's record-breaking engagement, January saw a cooldown: total impressions dropped 56% and readership efficiency fell 26%. But the story isn't about the dip — it's about what readers chose to engage with when they did.
Executive Summary
Readership Dashboard — January 2026 vs December 2025
January 2026 recorded 1,351,129 impressions — about 5.23% above the 2025 monthly average, but 56% below December 2025's all-time high.

Readers are more selective, not disengaged

Compared to December 2025, per-piece efficiency is down.
But zoom out and the picture is different: January's efficiency is only 19% below the second-half 2025 average (1,223 impressions/piece) and just 5% below the full-year 2025 average of 1,035 impressions/piece.
Readers are still showing up — they're just being pickier about what they click.
Top 3 Readership Insights
- Security content keeps drawing the most clicks — 4.17% CTR in January, continuing a streak of 3.50%–4.40% CTR since October 2025.
- Development content hit peak reader interest — 3,617 impressions/piece, the highest efficiency ever recorded for the category.
- Walkthroughs dominate the most-clicked list — More than 50% of the highest-CTR content pieces are hands-on walkthroughs.
Where Readers Found Content
Let's look at how readership distributed across platforms.

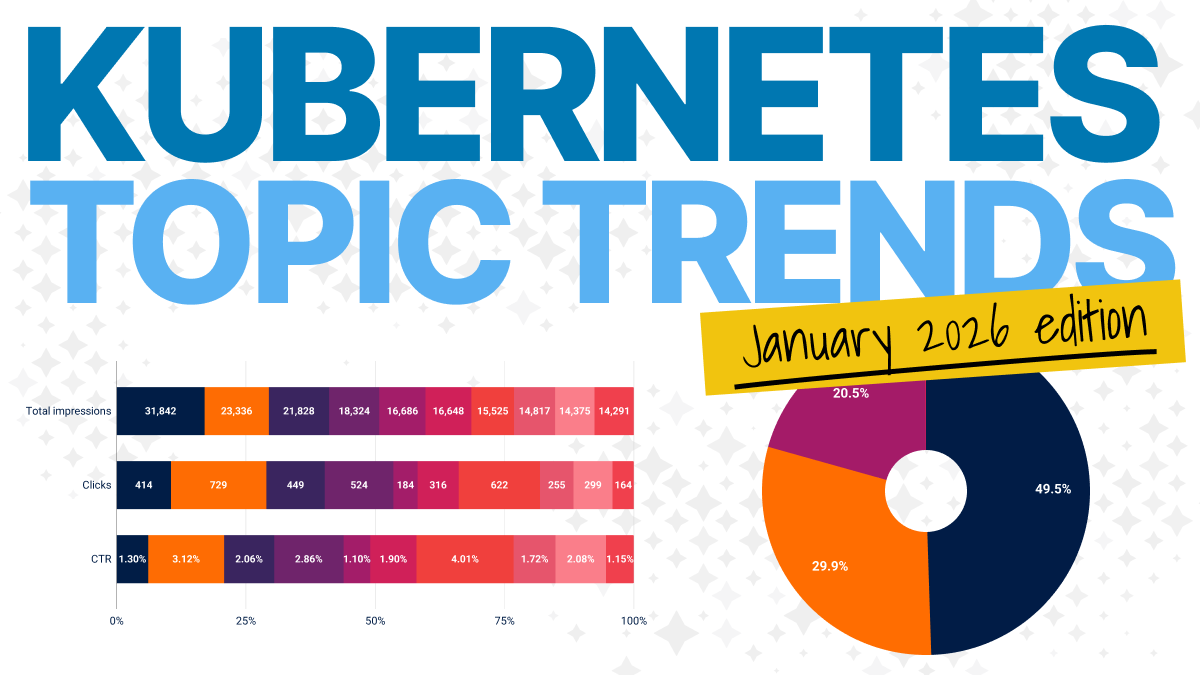
49.5% of content was shared on Twitter, 29.9% on Telegram, and 20.5% on LinkedIn.
Two podcast episodes were also published on YouTube and Spotify.
How did reader engagement differ by platform?

The platform hierarchy for cloud-native readership remained consistent: LinkedIn > Twitter > Telegram. But the engagement patterns per platform tell an interesting story.
LinkedIn holds steady, Twitter readership drops sharply

Key observations:
- LinkedIn engagement in January matched December 2025 — the benchmark month — suggesting that Kubernetes professionals on LinkedIn remain consistently engaged with cloud-native content.
- Telegram readership stayed close to its best-performing months of 2025.
- Twitter saw a dramatic decline: engagement efficiency dropped 52% and total impressions fell nearly 70% month-on-month. This could reflect algorithm changes (Twitter adjusted its algorithm in November 2025) or a broader shift in where Kubernetes practitioners consume content. Worth watching in February.
What Topics Readers Cared About
January revealed some notable shifts in reader interest across topic categories.
| Categories | Pieces | Total impressions | Average impressions per piece | CTR |
|---|---|---|---|---|
| Configuration Management | 24 | 109,733 | 4,572 | 2.72% |
| Development | 21 | 75,961 | 3,617 | 2.46% |
| Data on Kubernetes | 8 | 24,661 | 3,083 | 3.00% |
| Resource Optimization | 15 | 39,594 | 2,640 | 3.66% |
| Networking | 21 | 49,272 | 2,346 | 3.69% |
| Platform Engineering | 35 | 68,092 | 1,945 | 3.49% |
| Security | 20 | 27,447 | 1,372 | 4.26% |
| Infrastructure | 85 | 96,608 | 1,137 | 3.95% |
| Observability | 18 | 13,123 | 729 | 3.88% |
| Edge & IoT | 2 | 1,214 | 607 | 2.31% |
| Certifications | 5 | 2,726 | 545 | 2.90% |
What the data tells us about reader interest:
- Configuration Management drew the most attention per piece (4,572 impressions/piece) — readers remain deeply interested in how to manage Kubernetes configs at scale.
- Development content surged to #2 with 3,617 impressions/piece across 75K total impressions, suggesting growing reader appetite for developer-focused Kubernetes content.
- Security had the highest click-through rate at 4.26%, continuing a months-long pattern: readers don't just see security content, they act on it. This category has held a CTR between 3.50% and 4.50% throughout the second half of 2025.
- Infrastructure content showed a surprise CTR spike at 3.95%. For a high-volume category (96K impressions), that level of engagement is unusual and may signal renewed reader interest heading into 2026.
How Reader Engagement Shifted (January 2026 vs December 2025)

How did click-through behaviour change between the two months? (Excluding Edge & IoT and Certifications due to low volume):
- Most categories saw CTR growth, with the biggest gains in Data on Kubernetes (+0.72 pp), Resource Optimization (+0.57 pp), and Infrastructure (+0.47 pp). Readers clicked more selectively but more intentionally.
- Configuration Management and Development CTRs dipped (−0.58 pp and −0.66 pp respectively), likely because their high volume attracted a broader audience with lower click intent.
- The average CTR across categories hit 3.45% — the highest ever recorded. Even as total impressions fell, the readers who did engage were more likely to click through.
Readership by Brand

Engagement patterns across the LearnKube brands were consistent with November and December 2025:
- Architecture-focused content attracted the most readers, with 3,700 impressions per post. KubeArchitect content accounted for 41% of all impressions across the network — a clear signal that Kubernetes architecture remains the dominant area of reader interest.
- Educational, news, and architectural content together drove 86% of all readership. Podcast, events, and careers content still has room to grow in terms of reader engagement.
What Readers Clicked On Most

- Tool overviews dominated the reach charts. The two most-seen pieces were about Keel (31,843 impressions), a Kubernetes Operator for automating Helm, DaemonSet, StatefulSet, and Deployment updates, and ArgoCD_diff_preview (23,336 impressions), a tool for rendering manifest changes on pull requests.
- Only one walkthrough made the top 10 by reach — an interesting contrast with the CTR data, where walkthroughs dominate clicks.
- Two job postings (Platform Engineer and DevSecOps Engineer) broke into the highest-reach list for the first time, suggesting that career-focused content resonates with readers more than previously assumed.
Most-Clicked Content (>4% CTR and above 5,000 impressions)
| Content | CTR | Impressions | Clicks |
|---|---|---|---|
| GPU-based containers as a service | 7.80% | 8,247 | 8,247 |
| What Happens When You Delete a Kubernetes CustomResourceDefinition? | 7.65% | 6,566 | 6,566 |
| Kide: observability IDE | 5.43% | 10,441 | 10,441 |
| Standardizing CRD Condition Metrics in Kubernetes Operators | 4.92% | 5,776 | 5,776 |
| How We Moved a 2M RPM WebSocket Service to EKS and Fixed a Critical Bottleneck | 4.79% | 11,017 | 11,017 |
| Prom Analytics Proxy: Query Cost Tracking for Prometheus | 4.65% | 7,161 | 7,161 |
| Kubernetes Security: Best Practices to Protect Your Cluster | 4.49% | 6,120 | 6,120 |
| Cloud-Native RAG: embeddings + vectors, fully self-hosted | 4.47% | 5,484 | 5,484 |
| Freelens: Cross-Platform GUI for Kubernetes Cluster Management | 4.46% | 6,373 | 6,373 |
| Building Production-Ready Multi-Agent Systems on Kubernetes: Real Lessons from Deploying 11 Specialized AI Agents | 4.30% | 8,168 | 8,168 |
What happens when we categorise the most-clicked content by topic?

The pattern is clear:
- Half of the most-clicked content consists of walkthroughs. Readers want hands-on, practical guidance — not just overviews.
- 33% are tool overviews, confirming that the community actively seeks out new tooling.
- 22% are opinion pieces, showing appetite for perspective and analysis alongside practical content.
Key Trends
Development content is having a moment
Configuration Management and Resource Optimization have topped reader interest for over 12 months. But January saw Development content achieve the highest engagement efficiency ever recorded for any category — 3,617 impressions/piece with a solid base of 75K impressions. Is developer-focused Kubernetes content becoming the next big draw?
Security: readers don't just see it, they click it
For the fourth consecutive month, Security content led all categories in CTR (3.60%–4.30%). The volume of security content varies month to month, but when readers encounter it, they engage with it at a higher rate than anything else.
Architecture remains the centre of gravity
Architectural content accounted for 41% of all impressions across the LearnKube network in January 2026, extending its dominance as the broadest area of reader interest in the cloud-native space. At 3,700 impressions per post, it also led in per-piece efficiency.
Infrastructure may be poised for a comeback
Infrastructure has historically attracted high impressions through sheer volume of content. But in January, it also recorded the second-highest CTR at 3.95% — unusual for a high-volume category. If this trend holds, Infrastructure could be heading for renewed reader interest in 2026.
What This Means
1. Twitter readership needs investigation
Signal: 70% drop in reach, 52% drop in engagement efficiency vs December 2025.
Implication: Either Twitter's algorithm has shifted again, or Kubernetes practitioners are migrating to other platforms for technical content. February data will clarify the trend.
2. Development content demand is rising
Signal: Record-setting 3,617 impressions/piece. Strong 75K impression base.
Implication: Readers are increasingly seeking development-focused Kubernetes content. This could be an emerging trend for Q1 2026.
3. Security content consistently drives the most clicks
Signal: Highest CTR for four consecutive months (3.60%–4.30%).
Implication: Security remains the topic that most reliably converts impressions into clicks — readers actively seek it out.
4. Podcast listenership is growing
Signal: 72K impressions for the month, with room to grow.
Implication: Audio content is gaining traction with the Kubernetes community. This format-audience combination shows strong potential.
Conclusion
January 2026 saw a significant cooldown from December's record-breaking numbers — but the underlying reader behaviour tells a more nuanced story:
- Readers are more selective. Total impressions fell, but the average CTR hit an all-time high of 3.45%. People clicked less often, but when they did, they were more intentional.
- Development content is the breakout category. It achieved the highest per-piece engagement ever recorded, signalling a shift in what Kubernetes practitioners want to read about.
- Security content remains the most reliable click driver. Four consecutive months of leading CTR makes this the most consistent pattern in the data.
- Infrastructure engagement is rising beyond its usual volume-driven performance, hinting at renewed community interest.
Architecture-based content continues to dominate overall readership, accounting for more than 40% of all impressions. Meanwhile, the sharp decline in Twitter engagement raises questions about platform dynamics that deserve closer examination.
Looking ahead: February will be a telling month. Will Development content sustain its breakout performance? Will Twitter readership recover? And will Infrastructure's CTR surge prove to be a trend or a blip? We'll find out in the next report.