
Kubernetes Insights Report - August 2025
Published in September 2025
TL;DR: This report examines the August 2025 content performance across the LearnKube network (LearnKube, Kube Architect, Kubesploit, Kube Builders, Kube Events, Kube Careers, and KubeFm), comparing key metrics with July 2025 to identify trends and optimization opportunities.
In August 2025, we published 1,376 content pieces across multiple platforms, generating almost 1.5 million social media impressions.
Even though the overall volume decreased by 1.2% from July's 1406 content pieces, the network has maintained a good base volume of impressions and strong CTR performances in emerging categories such as resource optimization, configuration management, and security.
Executive Summary
Key Performance Dashboard - August vs July 2025
Since we published fewer posts in August (2.13% less) than in July, the total impressions were slightly down by 4.18% while the average engagement decreased by just 2.09%.

Top 3 Data-Driven Insights
- Resource optimization content achieves highest per-piece performance - 6,394 avg impressions vs infrastructure's 1,727.
- Security content continues strong CTR performance - \0.23pp vs July, indicating growing audience interest
- Educational content (Tutorials) rules performance charts - 7.89% - 12.90% CTR for top content.
Volume & Reach Analysis
Platform Distribution and Performance
Let's look at the content performance with respect to popular social media platforms.

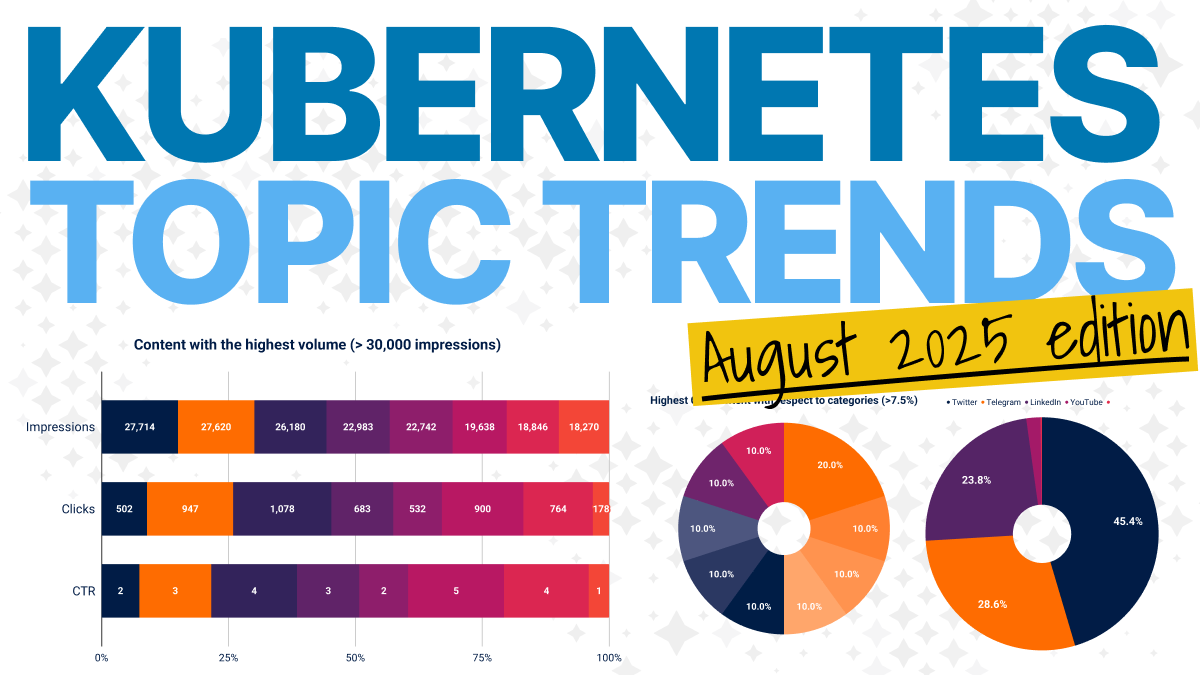
45.4% of all our posts were published on Twitter (given the short-form nature of the platform), while 28.6% were Telegram, and 23.8% were LinkedIn.
While YouTube made up for 2%, Spotify made up for just 0.2% of the total posts.
Cross-Platform Performance Insights
Even when we posted 91% more posts on Twitter vis-à-vis LinkedIn, the latter still resulted in 10% more total impressions than the former.
An even more interesting statistic is that we published 20% more posts on Telegram than on LinkedIn, yet it received almost 400% fewer impressions than LinkedIn.

With the above statistics, LinkedIn has the highest average impressions per post at 2,269, Twitter at 1,086, Telegram at 382, Youtube (302), and Spotify (134) wrapping up the list.
Platform Evolution - August vs July 2025
To better understand the current efficiency of content across platforms, let's compare the average impressions per post for July and August 2025.

In August, the average impressions for Twitter increased by 9% compared to July, while they fell by 7% for LinkedIn and 22% for Telegram during the same period.
Since YouTube and Spotify have low base numbers, the change in the metric for these platforms isn't conclusive.
Content Category Deep Dive
Content Performance analysis: Which Technical topics get the most attention?
While the higher frequency of Infrastructure topics (103) resulted in the highest total impressions for these topics (177,865), the details reveal a rather interesting story.
| Category | Pieces | Total impressions | Average impressions per piece | CTR |
|---|---|---|---|---|
| Resource Optimization | 26 | 166,233 | 6,394 | 3.64 |
| Configuration Management | 30 | 125,220 | 4,174 | 3.69 |
| Development | 36 | 128,505 | 3,570 | 3.01 |
| Observability | 19 | 60,427 | 3,180 | 3.23 |
| Networking | 38 | 119,546 | 3,146 | 3.25 |
| Platform Engineering | 43 | 118,377 | 2,753 | 2.74 |
| Data on Kubernetes | 11 | 25,545 | 2,322 | 4.24 |
| Security | 48 | 84,879 | 1,768 | 4.33 |
| Infrastructure | 103 | 177,865 | 1,727 | 2.74 |
| Certifications | 1 | 236 | 236 | 5.67 |
| Edge & IoT | 2 | 282 | 141 | 3.81 |
The key takeaways from the analysis are:
- Despite receiving the most total impressions, Infrastructure topics rank 9th in terms of average impressions per post (1,727 per post), which underlines their low efficiency.
- Resource optimization topics ranked the highest in this metric with an impressive 6,394 impressions per post, followed by Configuration management (4,174), Development (3,570), Observability (3,180), Networking (3,146), and Platform Engineering (2,753). It's interesting to see that despite having one of the lowest total impressions, Certification content got the highest click-through rate at 5.67%, followed by Security (4.33%), Data on Kubernetes (4.24%), Edge & IoT (3.81%), and Configuration management (3.69%) content.
CTR Performance Comparison (August vs July)

Barring Certifications and IoT content (since we only published three pieces for both topics combined), the most change in CTR has occurred for DoK and Platform Engineering content, with the former increasing by 1.41pp month-on-month and the latter decreasing by 0.80pp in the same period.
Infrastructure content went down by 0.52pp in August 2025.
Account Performance Analysis
August Account Performance

Note: Account performance appears steady across all accounts.
There lies a fascinating insight if we map the performance of each of our brands.
All our brands that publish educational/news/tutorial content make up only 39% of the total posts published, yet they attract 86% of the total impressions across the network.
What's also apparent is that KubeArchitect accounts for more than 35% of the network's total impressions and has a staggering efficiency of 3,539 impressions per post. Following in the efficiency hierarchy are LearnKube (2,495), KubeSpoilt (1,874), and K3s daily (1,218).
While we can't expect the same efficiency from our brands Kube Events, Kube Careers, and KubeFM, we need to evaluate the extent to which we can expand their reach.
Top Content Performance Analysis
Highest Volume Content (>15k impressions)

The content piece with the highest impressions in August 2025 was a Platform Engineering topic: KubeHatch: Dynamic Web-Based vCluster Provisioning Platform with 27,714 impressions. It was followed by a Resource optimization piece on Automated Pod Rebalancing and Eviction with Descheduler with 27,620 impressions but with double the clicks as the top-most content.
These were followed by Kubernetes Resource Recommender (26,180), KubeChecks: App updates (22,983), Fine-grained control with configurable HPA tolerance (22,742), Grogg – A Modern Local and Remote Kubernetes GUI for Developers (19,638), Kubernetes: the harder way (18,846), and our Instance calculator v3 piece (18,270).
While these content pieces had the most impressions, the CTR hierarchy differed slightly.
Highest CTR Content (>7.5%)
| Content | CTR | Clicks | Impressions | Category |
|---|---|---|---|---|
| Modern Kubernetes: can we replace Helm? | 15.87 | 889 | 5603 | Insight - Architecture |
| ECR to OCIR: Event-driven Docker Image Updates | 12.90 | 256 | 1984 | Tutorial - Infrastructure |
| CTA prerelease | 9.57 | 832 | 8697 | Educational - Webinar series |
| Offensive Container Security: Techniques, Misconfigurations, and Attack Paths | 9.50 | 406 | 4273 | Tutorial - Security |
| Helm dashboard | 8.67 | 301 | 3470 | Tool - Architecture |
| Implementing canary deployments on multi-cluster Kubernetes with ISTIO | 8.50 | 262 | 3083 | Tutorial Platform Engg/Networking |
| Using Kubernetes Secrets Store CSI Driver with HashiCorp Vault | 8.15 | 402 | 4934 | Tutorial - Security |
| Can a Simple 4-Core, 16 GB RAM Machine Reach 1000 TPS? | 8.14 | 277 | 3401 | Insight - Resource optimization |
| Optimizing Distributed Tracing with Jaeger DaemonSet: A Comprehensive Guide to Log Collection | 7.89 | 179 | 2270 | Tutorial - Observability |
| Key Learnings from Creating Multi-Tenant GKE Clusters on Google Cloud with Thousands of Publicly Addressable Services | 7.87 | 122 | 1550 | Insight - Platform/Infrastructure |
It gets really interesting if we categorize the highest CTR content according to its category and sub-categories.

The key takeaways here are:
- Tutorials attract the highest clicks. Security-related tutorials - more so.
- Insightful articles which put forth an opinion rank the second most popular well ahead of news, updates and tool-related content.
- Educational series, especially webinars, perform well if the topic is interesting enough for the audience.
Key Trends and Insights
Clear Content category winners
August 2025 data reveals a clear pattern of top-performing content.
Resource optimization content has been the most dominant topic, with a staging efficiency of 6,394 impressions per post — the best for any topic in the last six months.
Interestingly, Configuration management and Resource optimization topics traded places between August and July, confirming their in-demand status.
Security content is a solid bet
Security content has been performing well since the start of June 2025.
For the second month in a row, it has had the highest CTR performance numbers (4.33%).
It's also telling that articles such as Offensive Container Security and Using Kubernetes Secrets Store CSI Driver with HashiCorp Vault, both security topics, showed a high CTR range of 8.15-9.50%.
Confirmation of Infrastructure content decline
While we produced more than twice the content around Infrastructure topics vis-à-vis the average posting frequency, the efficiency for the topic ranks at the bottom tier.
While efficiency dropped 15% from June to July, it is now down 12% from July to August 2025.
The consistent decline in efficiency for Infrastructure topics suggests a saturation point has arrived, and this strategy needs re-evaluation.
Hands-on Tutorials/Walkthroughs are the best performing content.
Half of the best-performing CTR content falls under the Tutorial/Walkthrough category, which tells of the efficiency of such a form of content.
Strategic Recommendations
1. Expand Resource optimization content
Data: Highest efficiency for a topic in the last six months: 6,394 impressions per post and good CTR (3.64%)
Action: Identify key content pieces in the category to replicate more such content.
Priority: High - Best performing category.
2. Combine Hands-on Tutorials/Walkthroughs with the best-performing topics
Data: 50% of the best-performing CTR pieces are Tutorials/Walkthroughs, with impressions ranging from 2,270 to 4,934.
Action: Identify content pieces from the most popular topics: Resource optimization, Configuration management, and security that can be made into Tutorials/Walkthroughs.
Priority: High - proven high-engagement format and topics.
3. Leverage Security content momentum
Data: Highest CTR: 4.33%, and an average of 1,788 to 2,186 impressions per post between July and August.
Action: Increase the frequency of security content or increase the number of content pieces published on hands-on security content
Priority: Medium - High-engagement topic
Conclusion
- August 2025 marks an important articulation point in terms of identifying and confirming content trends for the LearnKube network.
- While there is a slight variance in post frequency (compared to July), content performance continues to be competitive.
- As security content continues to perform strongly, it tells of the community's acceptance and intrigue in the topic.
Meanwhile, Resource optimization and Configuration management are the most in-demand topics, averaging more than 120,000 impressions, and an average CTR not below 3.20% in the past two months.
Strategic Implications: Content creators and marketers should capitalize on emerging high-performance categories, namely Resource optimization, Configuration management, and Security, while acknowledging that infrastructure content efficiency has dropped.
Hands-on Tutorials/Walkthroughs are the most engaging form of content (7.89-12.90% CTR for the top-performing content).
Looking Forward: Platform performance stability across LinkedIn (2,330 avg impressions) and Twitter (1,181 avg impressions) provides a solid foundation for scaling successful content formats while optimizing underperforming categories.